
A daily production report is the foundational document that captures production output, downtime, scrap, and shift performance in a single, structured record. In food manufacturing, this document goes by several names: daily output report, shift performance log, or production performance tracking sheet. Regardless of the label, the function is the same. It records what actually happened on the floor versus what was planned, and it gives operation managers and production leads the data they need to act fast. Without it, decisions rely on memory and whiteboard notes, two sources that fail under pressure.
What does a daily production report include?
A standard daily production report covers six core categories: general information, production output, variance analysis, scrap and reject quantities, downtime tracking, and qualitative shift notes. Each category serves a distinct purpose. General information anchors the record with date, shift, line, and supervisor name. Production output captures units planned versus units completed. Variance analysis quantifies the gap between the two.
Downtime tracking is where most food manufacturers underinvest. Common downtime reasons include machine breakdown, material shortages, and equipment changeovers, each measured in minutes. Tracking these reasons separately, not just total minutes lost, is what makes the report useful for root cause analysis. Scrap and reject quantities, recorded by product and reason code, feed directly into quality control decisions. Shift notes capture context that numbers cannot: a late ingredient delivery, a new operator on the line, or an unusual equipment sound.

The production report template you use should reflect your specific lines and products. A bakery tracking oven cycles needs different fields than a beverage plant tracking fill rates. The structure is universal; the content is yours to define.
Pro Tip: Keep your production report template under 20 input cells per work center per shift. Fewer fields mean faster completion, higher compliance, and cleaner data.
| Report component | Purpose in food manufacturing |
|---|---|
| General information | Identifies shift, line, date, and responsible supervisor |
| Production output | Records planned vs. actual units completed |
| Variance analysis | Quantifies performance gaps for follow-up |
| Scrap and rejects | Tracks waste by product and reason code |
| Downtime log | Captures lost time by category and duration |
| Shift notes | Documents context that raw numbers miss |
How to write a production report accurately
Accurate reporting starts before the shift ends, not after. Operators and line leads who wait until the end of a shift to record data rely on recall, which degrades fast. The better practice is to log data in real time or at defined intervals during the shift.
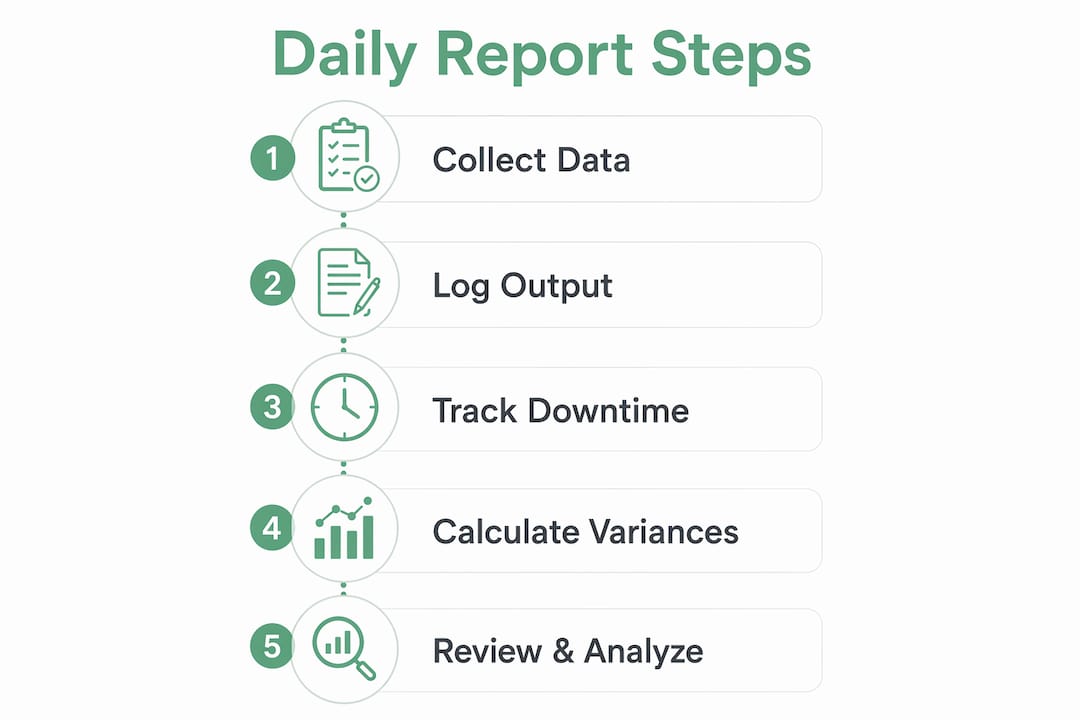
Follow this sequence for each shift:
- Record planned output at shift start. Pull the number from the production schedule. This is your baseline for every variance calculation.
- Log actual output at defined checkpoints. Hourly or by batch, depending on your line speed. Do not wait for end-of-shift totals.
- Document each downtime event as it happens. Note the start time, end time, reason code, and the operator who reported it.
- Count and record scrap by product and reason. Assign a reason code to every reject. "Other" is not a reason code.
- Complete shift notes before the supervisor signs off. Notes should capture anything that affected output or quality that the numbers do not explain.
- Cross-check totals against machine counters or batch records. Discrepancies between the report and equipment data are a signal, not a rounding error.
Responsibility for report completion should sit with the shift supervisor, not the operator. Operators provide the data; supervisors verify and sign off. This separation reduces errors and creates a clear accountability chain. Establishing clear data ownership is the single most effective way to reduce inconsistencies across shifts.
Report fatigue is the most common failure mode in daily production reporting. Rushed and inaccurate reporting obscures the true root causes of delays. The fix is not more training. The fix is a shorter, better-designed form that operators can complete in under five minutes.
Pro Tip: Assign a specific person to own each data field. When everyone is responsible, no one is. Named ownership cuts data gaps significantly.
How to analyze a daily production report for real improvements
The daily production summary becomes useful only when someone reads it critically, not just files it. Variance analysis is the starting point. A gap between planned and actual output tells you something went wrong. The downtime log tells you what. The shift notes tell you why.
Production leads who use their daily output report as the focal point for morning stand-up meetings resolve issues faster than those who rely on verbal handoffs. The report gives the team a shared, factual starting point. It replaces "I think we had a slow night" with "We lost 47 minutes to a conveyor jam on Line 3."
Patterns across multiple days reveal systemic problems. A single downtime event is noise. The same downtime reason appearing three days in a row is a bottleneck. Scrap data analyzed by product and shift can expose a quality issue tied to a specific operator, a specific ingredient lot, or a specific time of day.
Key insights you can draw from consistent daily reporting:
- Recurring downtime reasons point to equipment that needs preventive maintenance or a process step that needs redesign.
- Consistent output shortfalls on specific shifts suggest a staffing, training, or scheduling issue rather than an equipment problem.
- Scrap spikes on specific products often trace back to raw material variability or a changeover procedure that needs tightening.
- Variance trends over a week show whether a corrective action actually worked or just shifted the problem.
- First pass yield patterns reveal where rework is hiding and costing you time you are not tracking.
Production reports that monitor first pass yield and integrated downtime metrics give operations teams the depth they need to drive real improvement, not just document what went wrong.
Customizing your report for food manufacturing environments
A generic production report template does not account for the realities of food manufacturing: allergen changeovers, temperature-sensitive processes, regulatory hold requirements, and batch traceability. Your report needs to reflect these realities or it will not get used correctly.
Align your downtime categories with the events that actually stop your lines. In food manufacturing, that often means adding categories like "CIP cycle overrun," "allergen changeover," "ingredient hold," and "packaging material shortage." Generic categories like "planned maintenance" and "unplanned downtime" are too broad to drive decisions.
Quality metrics in food manufacturing go beyond simple reject counts. Track rejects by reason code, by product, and by shift. If your facility runs HACCP or SQF protocols, your report fields should mirror the critical control points you monitor. This alignment makes the report useful for both operational decisions and audit preparation.
Balancing report detail with usability is the design challenge every operation manager faces. Excessive fields reduce compliance and degrade data quality. The goal is a report that captures everything decision-relevant and nothing else.
Manual reporting in Excel or Google Sheets works well for facilities with stable, low-complexity lines. Excel and Google Sheets remain the most common formats, supporting shift-wise, machine-wise, and plan-vs-actual tracking. Partially automated reporting, where equipment data feeds directly into the report template, reduces manual entry and the errors that come with it. The tradeoff is setup time and the need for consistent input discipline from the team.
| Reporting method | Key benefit | Main limitation |
|---|---|---|
| Manual (paper forms) | No setup cost, works anywhere | Prone to transcription errors and delays |
| Spreadsheet templates | Flexible, familiar, low cost | Requires manual entry, version control issues |
| Partially automated | Reduces entry errors, faster | Requires setup and team discipline |
| Fully integrated platform | Real-time data, AI-generated insights | Higher implementation effort for SMBs |
Common challenges when implementing daily production reporting
The most common obstacle is not resistance to reporting. It is a poorly designed report that takes too long to complete. Inconsistent data sources like whiteboard notes, spreadsheet fragments, and verbal handoffs create accuracy problems that undermine trust in the data. When supervisors stop trusting the report, they stop using it.
Timing delays compound the problem. A report completed two hours after shift end captures less accurate data than one completed during the shift. Build report completion into the shift routine, not as a closing task but as an ongoing one.
Streamlined templates, designated data owners, and a short weekly review of report quality all reduce these problems. The weekly review does not need to be long. Ten minutes spent checking for data gaps and inconsistencies catches problems before they become habits.
Delayed reviews reduce report effectiveness significantly. The data in a daily production summary is most valuable within 24 hours. After that, the window for corrective action on that shift's issues has closed.
Pro Tip: Add a single "context" field to your shift notes section. One sentence from the supervisor explaining the biggest challenge of the shift gives analysts the context they need to interpret the numbers correctly.
Key Takeaways
A well-designed daily production report, completed consistently and reviewed promptly, is the most direct path from floor-level data to operational decisions that actually improve performance.
| Point | Details |
|---|---|
| Six core components | Every effective report covers output, variance, scrap, downtime, general info, and shift notes. |
| Real-time data entry | Log downtime and output during the shift, not after, to preserve accuracy. |
| Stand-up meeting anchor | Use the report as the factual starting point for daily team alignment discussions. |
| Limit input fields | Keep entries under 20 cells per work center per shift to maintain compliance and data quality. |
| Customize for food manufacturing | Add food-specific downtime and quality categories to make the report operationally relevant. |
What I have learned from years of production reporting in food manufacturing
The reports that actually change operations share one trait: they are short enough that supervisors complete them honestly. Every time I have seen a facility add fields to a report, compliance drops within two weeks. The team fills in what they can remember, skips what they cannot, and the data becomes unreliable. The instinct to capture more is understandable. The result is always the same.
The second thing I have learned is that the report is not the product. The conversation it enables is the product. A daily output report that sits in a shared drive and never gets discussed in a stand-up meeting is just paperwork. The facilities that improve fastest are the ones where the production lead walks into the morning meeting with the report already reviewed and two questions ready: "Why did we lose 40 minutes on Line 2?" and "What are we doing about it today?"
The third lesson is harder to accept: your first report template will be wrong. Not wrong in a catastrophic way, but wrong in the sense that it will not capture the right things for your specific lines and products. Build it, use it for 30 days, ask your supervisors what is missing and what is useless, and revise it. The best production report templates I have seen went through at least three iterations before they stuck. Treat the template as a living document, not a finished product.
— Trevor
How Gembalabs changes what daily reporting can do
Manual spreadsheets capture what happened. Gembalabs shows you why it happened and what to do next.
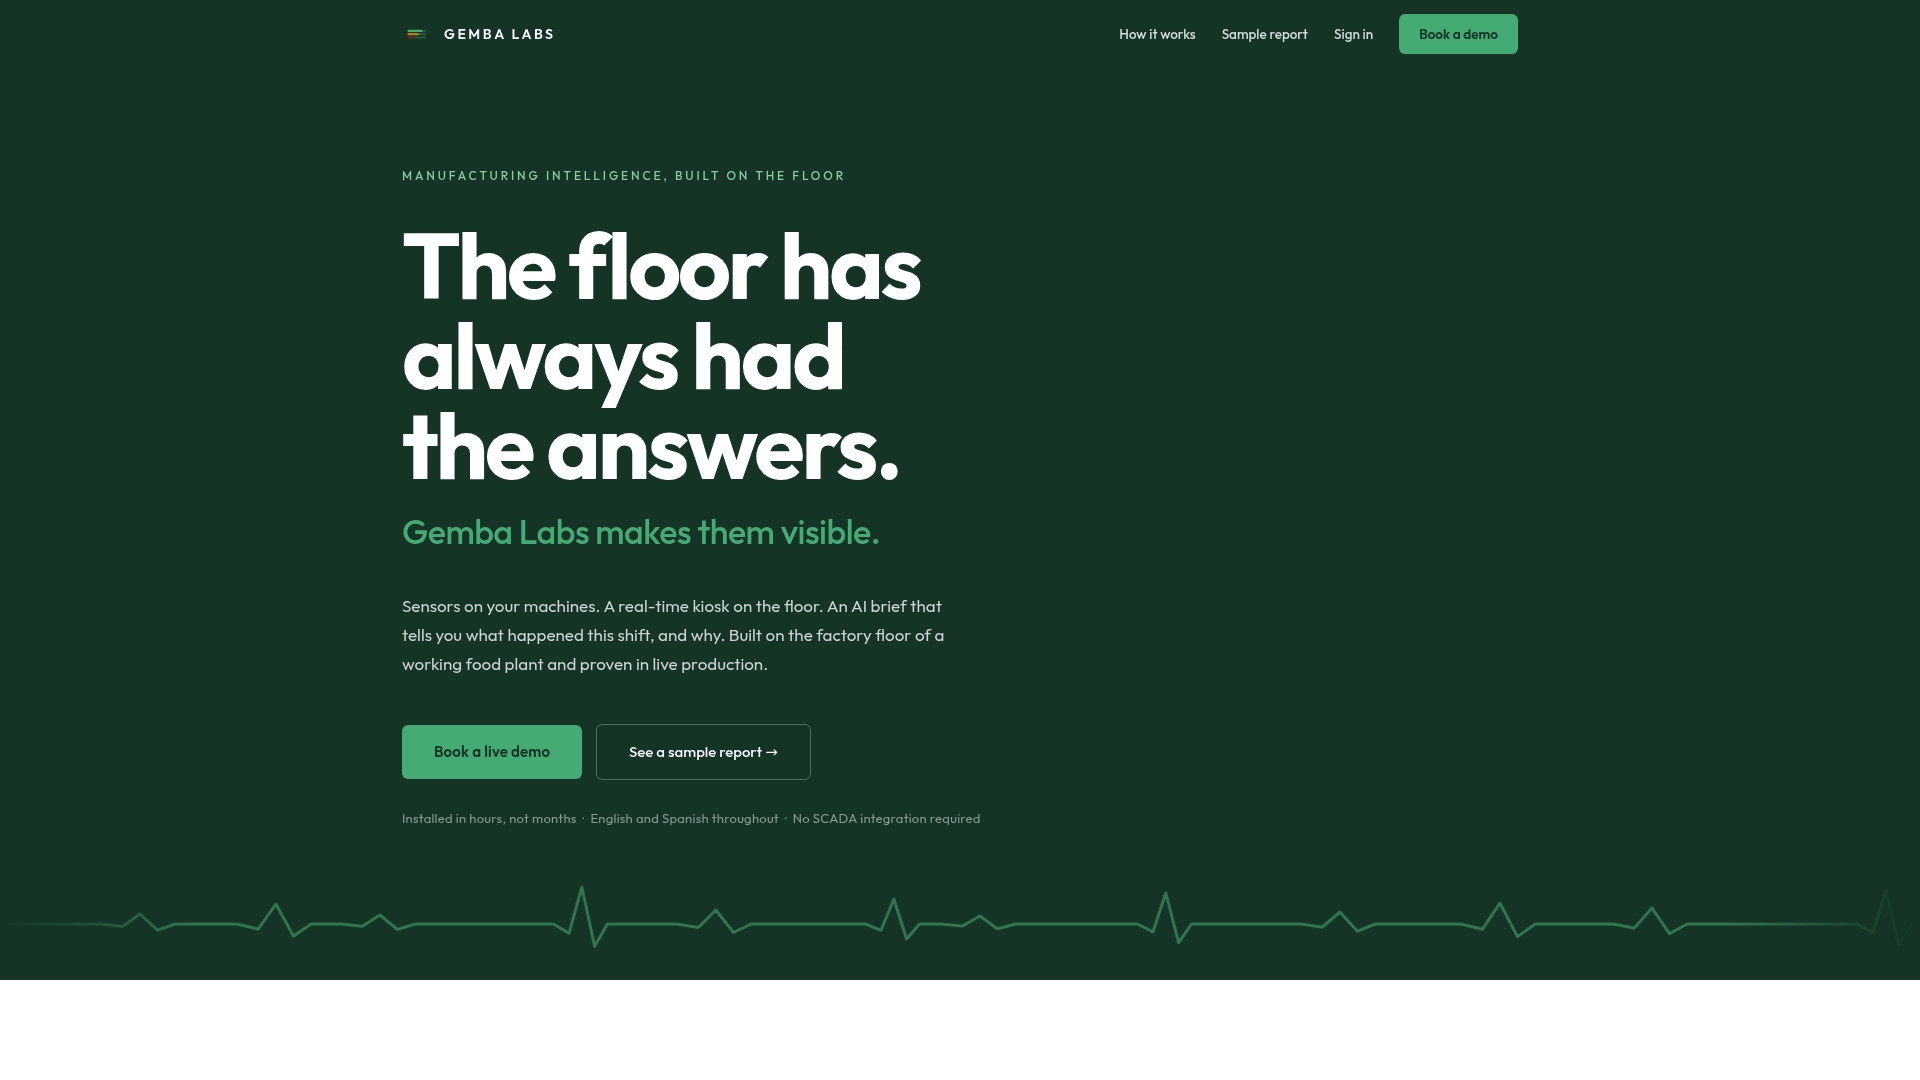
Gembalabs is built for small and medium-sized food manufacturers who need more than a filled-in template. The platform pulls raw data from equipment cycles and combines it with human-entered data like downtime reasons and rework counts. The result is a daily production summary that reflects both machine behavior and operator decisions in one view. AI-generated reports let you ask specific questions about your facility and get answers grounded in your actual data, not industry averages. For operation managers who want to move from reactive reporting to real operational control, Gembalabs is the platform built for that shift.
FAQ
What is a daily production report?
A daily production report is a structured document that records planned versus actual output, downtime, scrap, and shift notes for a single production day. It serves as the primary data source for operational decisions and team alignment meetings.
How do I write a production report for a food manufacturing facility?
Record planned output at shift start, log actual output and downtime events in real time, count scrap by reason code, and have the shift supervisor verify and sign off before the shift closes. Keep the template under 20 input fields per work center to maintain accuracy.
What fields should a production report template include?
A production report template should include general shift information, planned and actual output, variance calculations, scrap quantities by reason code, downtime events with duration and reason, and a brief supervisor notes field.
How often should daily production reports be reviewed?
Report data reviewed promptly in daily stand-up meetings produces the best outcomes. Waiting longer than 24 hours reduces the ability to act on the findings before the next shift compounds the same issues.
What is the difference between a daily production report and a production schedule?
The production schedule sets planned targets for output and timing. The daily production report documents what actually happened against those targets, creating the feedback loop that improves schedule accuracy over time.