
Equipment performance monitoring is the continuous process of collecting and analyzing real-time data from industrial machines to track health, output, and efficiency before problems escalate. If you manage a production floor, this is the difference between catching a failing motor bearing on Tuesday and losing an entire shift on Friday.
The core elements of any monitoring program include:
- Sensors that capture vibration, temperature, electrical current, and pressure at the machine level
- Connectivity layers (typically IoT networks) that transmit raw data to a central platform
- Analytics software that converts raw readings into alerts, dashboards, and maintenance triggers
- Human input channels for operator notes, downtime logs, and rework records
- Reporting tools that surface patterns across shifts, lines, and time periods
Together, these components give operations teams a live picture of what every asset is doing, and more importantly, what it is about to do.
Table of Contents
- How does equipment performance monitoring actually work?
- What monitoring techniques and sensors does your facility actually need?
- Why monitoring machine performance pays off faster than most managers expect
- Common challenges that stall monitoring programs before they deliver results
- How to evaluate and choose the right monitoring service or platform
- How Gembalabs approaches equipment monitoring in food manufacturing
- Gembalabs gives food manufacturers a clearer picture of what is actually happening
- Key Takeaways
How does equipment performance monitoring actually work?
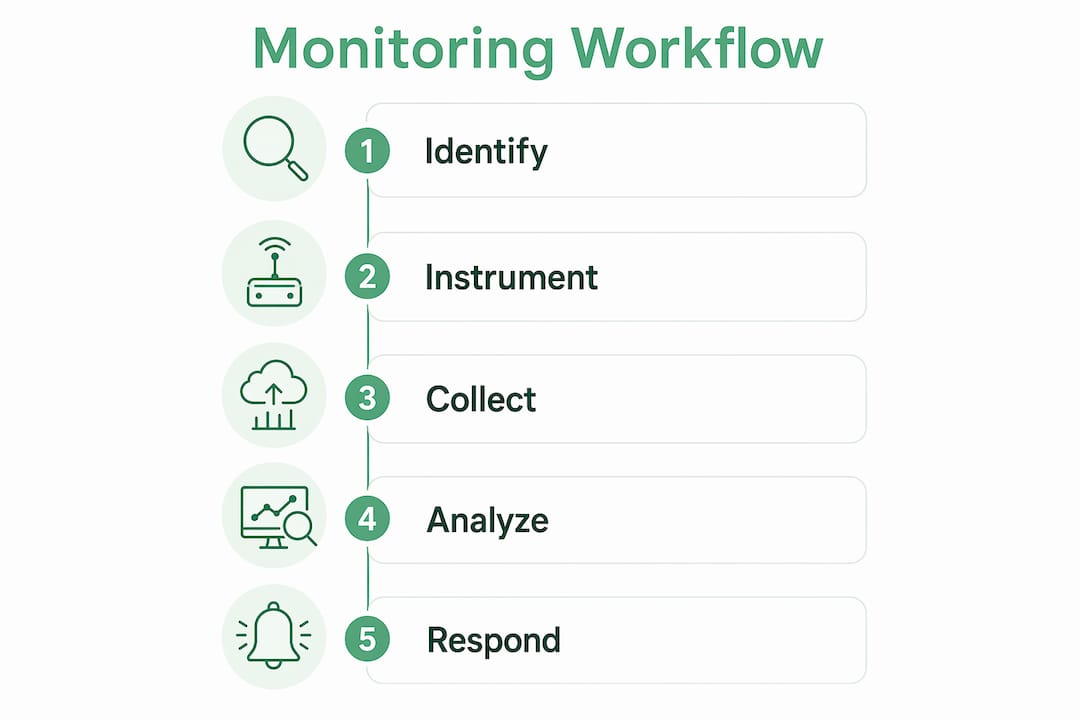
Equipment monitoring systems collect real-time machine data via sensors and IoT networks, process it, and deliver insights through dashboards and alerts to support proactive maintenance. Here is the operational flow, step by step:
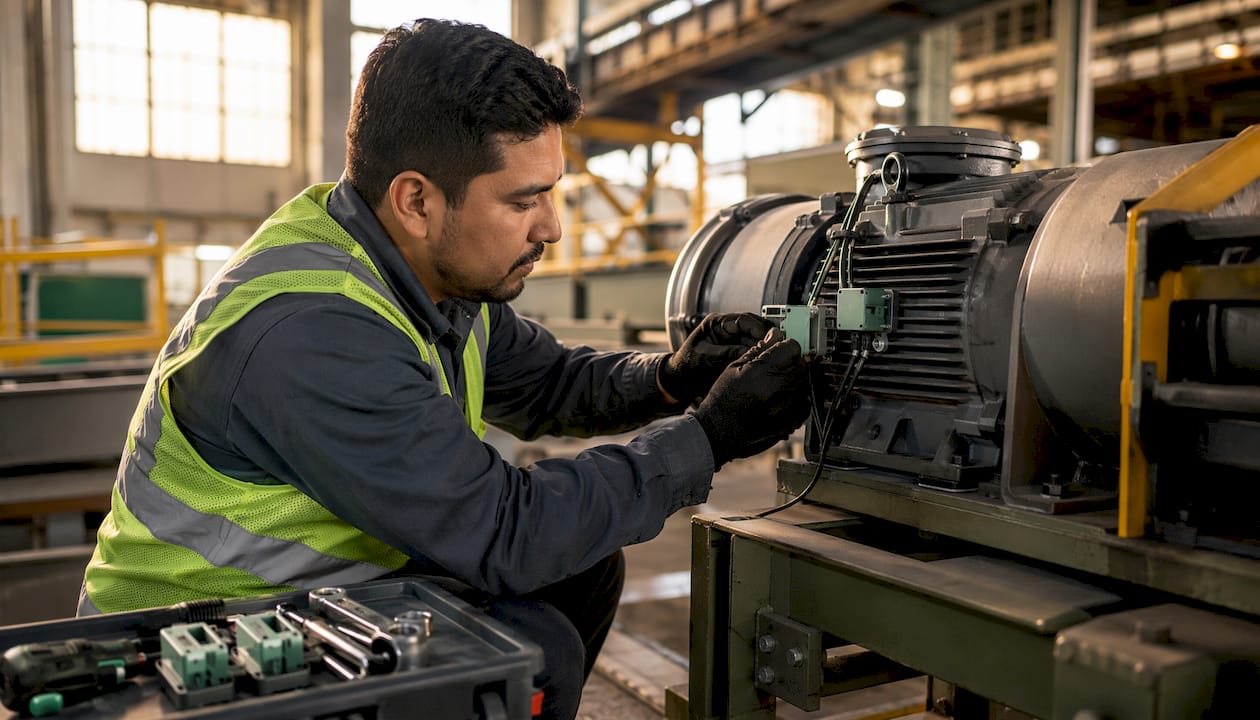
- Sensor installation — Vibration, thermal, and current sensors are mounted directly on or near target equipment. Placement matters: a vibration sensor on the wrong axis misses the fault signature you are looking for.
- Real-time data acquisition — Sensors stream readings continuously, often at millisecond intervals, to an edge device or gateway on the plant floor.
- IoT transmission — The gateway pushes data to a cloud or on-premise platform via protocols like MQTT or OPC-UA, keeping latency low enough for meaningful alerts.
- Data processing and normalization — The platform filters noise, applies baseline thresholds, and calculates derived metrics like Overall Equipment Effectiveness (OEE).
- Visualization and alerting — Dashboards display live KPIs; alert rules fire when readings cross defined thresholds, notifying maintenance teams before failure occurs.
- Maintenance decision-making — Technicians use alert context and trend data to schedule targeted repairs, replacing the old "run it until it breaks" approach with evidence-based scheduling.
- Continuous improvement loop — Historical data feeds back into threshold calibration and predictive models, making the system more accurate over time.
Each step depends on the one before it. Skipping baseline establishment in step four, for example, means your alerts will either fire constantly or not at all.
What monitoring techniques and sensors does your facility actually need?
Three main sensor techniques cover the majority of industrial equipment health monitoring: vibration, thermal, and electrical current monitoring. Most facilities need all three.
- Vibration monitoring detects mechanical wear, imbalance, misalignment, and bearing defects. It is the go-to method for rotating equipment like motors, pumps, and compressors. Frequency spectrum analysis can pinpoint fault type before any visible damage appears.
- Thermal monitoring uses infrared sensors or thermal cameras to flag overheating in motors, electrical panels, and friction points. A bearing running 15°F above baseline is a warning; at 40°F above, you are hours from failure.
- Electrical current monitoring tracks load changes and power draw on motors. A gradual current increase on a conveyor motor often signals mechanical resistance building up, long before the motor trips.
- Integrated IIoT platforms aggregate data from all three sensor types into a single view. Industrial IoT platforms help reduce unplanned downtime by enabling predictive maintenance and addressing machine issues before failure. The aggregation layer is what turns individual sensor readings into a coherent picture of asset health across an entire facility.
Pro Tip: Don't start by instrumenting everything. Pick your two or three highest-consequence assets, establish clean baselines, and expand from there. A well-monitored critical line beats a poorly monitored whole plant every time.
Why monitoring machine performance pays off faster than most managers expect
Transitioning to real-time performance monitoring moves maintenance from reactive firefighting to proactive scheduling, reducing downtime costs and extending asset lifespan. The operational and financial case is straightforward:
- Unplanned downtime drops because issues are caught in the degradation phase, not at the point of failure. A food production line that goes down mid-run costs far more than the repair itself once you factor in lost product, cleaning, and restart time.
- Maintenance costs fall when technicians work on what actually needs attention rather than following fixed time-based schedules. Condition-based maintenance eliminates unnecessary part replacements.
- OEE improves directly. OEE measures equipment availability, performance, and quality to identify efficiency losses and guide improvements in real time. Facilities that track OEE consistently find hidden capacity they did not know existed.
- Asset lifespan extends because equipment running within healthy parameters degrades more slowly. That defers capital expenditure on replacements.
- Energy consumption decreases when motors and compressors are not working harder than necessary to compensate for mechanical inefficiency.
Real-time OEE monitoring systems integrate IoT sensor data to calculate availability, performance, and quality metrics, providing insights through dashboards that help improve productivity, reduce downtime, and enhance quality control.
Common challenges that stall monitoring programs before they deliver results
Most monitoring initiatives do not fail because the technology is wrong. They stall because the implementation underestimates the operational side.
- Legacy equipment integration is the most common technical barrier. Older machines often lack communication ports, requiring retrofit sensors and custom data bridges. Budget for this upfront.
- Data overload hits teams that instrument everything at once without a clear alert hierarchy. When every sensor fires a notification, technicians stop trusting the system within weeks.
- Staff adoption is harder than the vendor pitch suggests. Operators who have run equipment by feel for 15 years need to see the monitoring data validate their instincts before they trust it. Training must be hands-on, not just a slide deck.
- ROI justification can be difficult in the first 90 days before the system has caught a real failure. Document every near-miss the system surfaces, not just the downtime it prevents.
- System accuracy drift happens when baselines are set once and never updated. Equipment condition changes seasonally and after maintenance events; thresholds need regular recalibration.
Effective equipment monitoring requires clear goal setting, baseline establishment, tool selection, automation, and ongoing analysis and adjustment. The "ongoing" part is where most programs lose momentum.
How to evaluate and choose the right monitoring service or platform
Equipment performance monitoring services use sensors, data analytics, and real-time alerts to reduce downtime, improve productivity, optimize maintenance schedules, and save costs. The market breaks into three broad tiers:
- Sensor-only providers supply hardware and leave data interpretation to your team. Low upfront cost, high internal burden. Works well if you already have a data engineering capability.
- Analytics platforms ingest data from your existing sensors and provide dashboards, alerting, and reporting. The right fit when hardware is already in place but visibility is lacking.
- Full-service platforms handle sensor installation, connectivity, analytics, and ongoing support. Higher cost, faster time to value, and less demand on internal resources.
When evaluating any option, prioritize these features:
- Real-time alerting with configurable thresholds, not just daily reports
- Predictive analytics that flag degradation trends, not just threshold breaches
- Integration with your existing CMMS or maintenance management system so work orders generate automatically
- Reporting dashboards your operators can actually read without a data science degree
- Scalability from a single line to a full facility without a platform replacement
Pilot on one line or one asset class before committing to a facility-wide rollout. A 60-day pilot with clear success metrics tells you more than any vendor demo.
How Gembalabs approaches equipment monitoring in food manufacturing
Food manufacturing has monitoring requirements that general industrial platforms often miss. Sanitation cycles, allergen changeovers, and regulatory recordkeeping create data complexity that a generic OEE dashboard does not handle well. Gembalabs was built specifically for small and medium-sized food manufacturers who need more than raw sensor output.

The platform combines machine cycle data with human-entered production intelligence, including downtime reasons, rework counts, and operator notes, into a single view. That combination matters because a sensor can tell you a line stopped; it cannot tell you the line stopped because the operator was waiting on a forklift. Gembalabs captures both.
AI-generated reports let production managers ask specific questions about their facility and get answers in plain language, not just charts. The bilingual interface (English and Spanish) means the operators entering data and the managers reading reports are working in the same system without a translation gap.
A mid-sized tortilla manufacturer piloting Gembalabs identified a recurring rework spike on their second shift that sensors alone had flagged as a speed anomaly. When operator notes were layered in, the root cause was a specific dough batch timing issue that only appeared after a certain run length. That insight came from combining machine data with human production records, something a sensor-only platform would have missed entirely.
Pro Tip: When rolling out any monitoring platform in a food facility, start with your highest-rework line, not your most complex one. Rework data is easy to validate against existing quality records, which builds team confidence in the system fast.
Gembalabs gives food manufacturers a clearer picture of what is actually happening
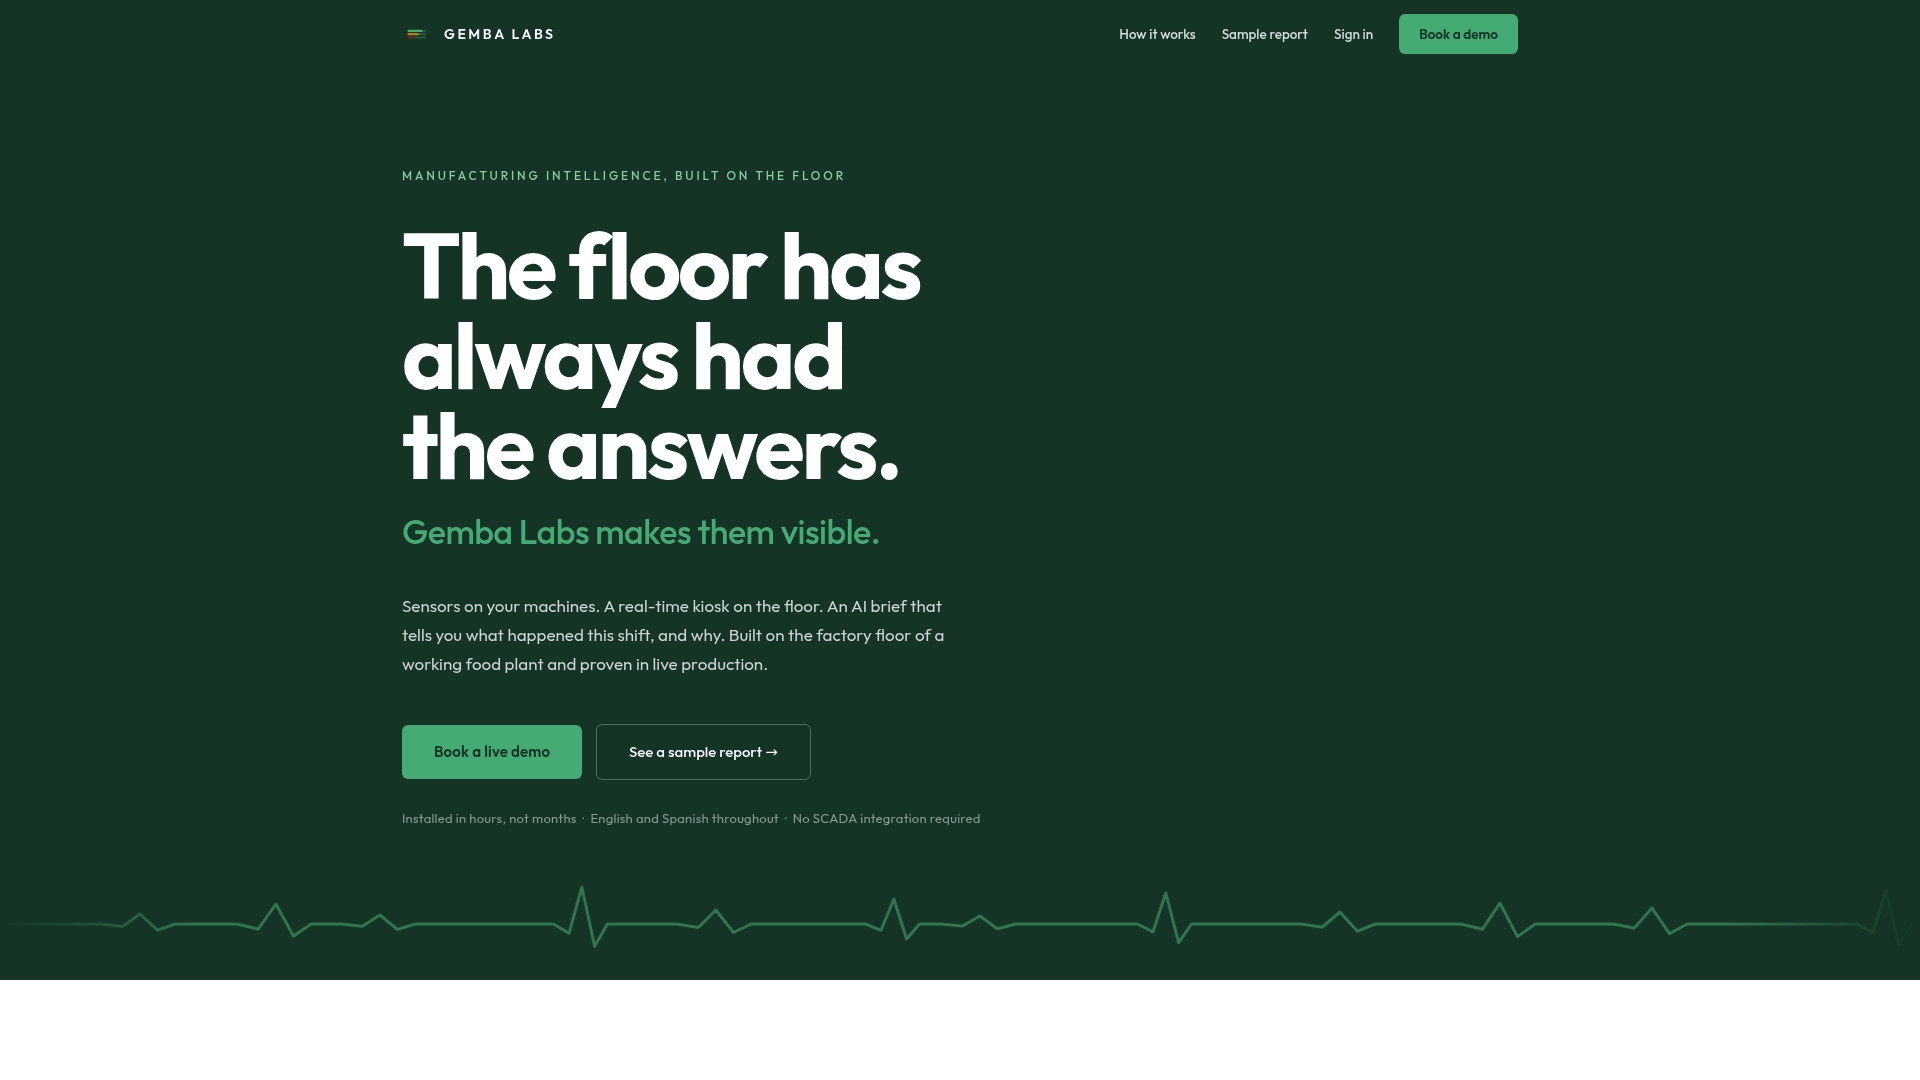
Most monitoring platforms give you data. Gembalabs gives you answers. For small and medium-sized food manufacturers, that distinction is practical: you do not have a data science team to interpret raw sensor feeds, and you cannot afford to wait for a consultant to tell you why your line efficiency dropped on Tuesday.
Gembalabs connects sensor data, operator input, and AI-generated reporting into one platform built for the realities of food production, including shift handoffs, rework tracking, and bilingual teams. You get a daily picture of what happened, why it happened, and where to focus next, without building a custom analytics stack.
If you are ready to move from guesswork to grounded production intelligence, see how Gembalabs works and request a pilot for your facility.
Key Takeaways
Equipment performance monitoring delivers the most value when machine data and human input are combined into a single, continuously updated picture of facility health.
| Point | Details |
|---|---|
| Start with critical assets | Instrument your highest-consequence equipment first; expand after baselines are established. |
| Combine sensor and human data | Machine readings alone miss operator-level causes; integrating both reveals the full picture. |
| OEE is the core metric | OEE tracks availability, performance, and quality to identify efficiency losses in real time. |
| Pilot before scaling | A 60-day single-line pilot with clear success metrics outperforms a rushed facility-wide rollout. |
| Gembalabs for food manufacturing | Gembalabs combines machine cycle data, operator notes, and AI reporting for small and mid-sized food producers. |