
OEE measures how well your equipment performs during the time it is scheduled to run. TEEP measures how well it performs against every hour on the calendar, 24 hours a day, 7 days a week, 365 days a year. That single difference in time base changes everything about how you interpret the number and what decision you make with it.

The relationship between the two is direct: TEEP = OEE × Utilization, where Utilization equals scheduled production hours divided by total calendar hours. Because Utilization is always less than or equal to 100%, TEEP is always lower than OEE. A plant running two shifts will almost always show a TEEP noticeably lower than its OEE score, and that gap is not a failure. It is a map of untapped capacity.
Here is the practical split in purpose:
- OEE answers: "How well did we run during our scheduled time?"
- TEEP answers: "How much of our total potential capacity are we actually using?"
- OEE drives daily operational improvement, shift targets, and operator accountability.
- TEEP drives capacity planning, capital investment decisions, and shift-addition analysis.
- TEEP includes a Utilization factor that OEE deliberately excludes.
Table of Contents
- How OEE and TEEP are calculated
- What the difference between OEE and TEEP actually tells you
- When to use OEE, when to use TEEP, and when to use both
- What losses drive OEE and TEEP down
- How Gembalabs helps you track and act on both metrics
- Limitations and challenges in measuring OEE and TEEP accurately
- Strategies to improve OEE and TEEP metrics
- Key Takeaways
How OEE and TEEP are calculated
Both metrics share the same three core factors: Availability, Performance, and Quality. The difference is that TEEP adds a fourth: Utilization.

OEE = Availability × Performance × Quality
TEEP = OEE × Utilization (or equivalently, Availability × Performance × Quality × Utilization)
Each factor captures a distinct category of loss. Availability is the percentage of scheduled time the equipment was actually running, after subtracting unplanned downtime. Performance is the ratio of actual output speed to the theoretical maximum speed. Quality is the share of output that meets spec on the first pass, with no rework required.
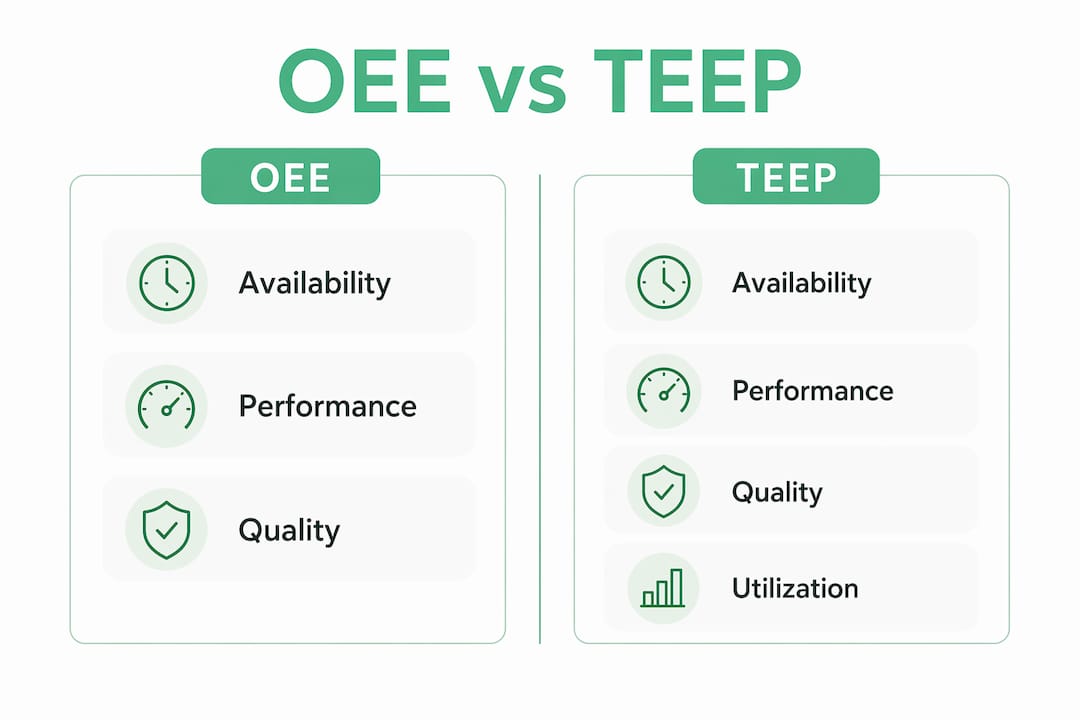
Utilization, the factor unique to TEEP, is simply scheduled production time divided by total calendar time. A plant running two 8-hour shifts, 5 days a week, schedules roughly 4,160 hours per year against 8,760 total calendar hours, giving a Utilization of about 47%.
| Element | OEE | TEEP |
|---|---|---|
| Time basis | Planned production time | All calendar time (8,760 hrs/year) |
| Availability factor | Actual run time ÷ scheduled time | Actual run time ÷ scheduled time |
| Performance factor | Actual output ÷ theoretical max output | Actual output ÷ theoretical max output |
| Quality factor | Good units ÷ total units produced | Good units ÷ total units produced |
| Utilization factor | Not included | Scheduled time ÷ calendar time |
| Formula | Availability × Performance × Quality | OEE × Utilization |
A worked example: A food production line runs two shifts, 5 days a week. Its Availability is 82%, Performance is 90%, and Quality is 95%, resulting in an OEE around 70%. Utilization is roughly half of total calendar time. The resulting TEEP is significantly lower than OEE, reflecting scheduled operation versus total time.
That gap between OEE and TEEP is not a problem to fix on the shop floor. It reflects a scheduling decision: the plant simply does not run nights or weekends.
What the difference between OEE and TEEP actually tells you
The gap between your OEE and TEEP scores carries more strategic information than either number alone.
| Dimension | OEE | TEEP |
|---|---|---|
| Time base | Planned production time | All calendar time |
| Typical mid-market score | The mid-market OEE is often around 60% | Mid-market TEEP for two-shift operations is substantially lower |
| World-class benchmark | Around 85% | Around 60% or more, typically requiring 24/7 operation |
| Primary audience | Line supervisors, operators, CI teams | Plant managers, CFOs, capital committees |
| Decision it supports | Operational improvement | Capacity expansion, investment justification |
| Includes scheduling losses | No | Yes |
A common misconception is that a low TEEP signals poor operational performance. It usually does not. A plant with a 70% OEE and a TEEP a bit above 30% is running its scheduled shifts well. The TEEP is low because the plant is not staffed around the clock. Conversely, a plant with a 70% OEE and a TEEP approaching 60% is already heavily utilized. If that plant needs more output, it needs hardware, not another shift.
The other pitfall is using TEEP to compare plants with different shift schedules. A 30% TEEP plant can look worse than a 60% OEE plant running the same operation, simply because the denominators are different. Cross-plant benchmarking belongs with OEE, not TEEP.
Pro Tip: Always decompose a TEEP figure into its scheduling component and its operational component before presenting it to leadership. A TEEP of 33% means something very different if it comes from a high-OEE plant running limited shifts versus a low-OEE plant running around the clock.
When to use OEE, when to use TEEP, and when to use both
The right metric depends entirely on the question being asked, and getting this wrong leads to bad decisions.
Use OEE when:
- Setting daily or weekly improvement targets for operators and line supervisors.
- Comparing performance across shifts or production lines within the same plant.
- Diagnosing the root cause of output shortfalls during scheduled production.
- Benchmarking against industry standards for equipment performance.
Use TEEP when:
- Evaluating whether to add a third shift before buying new equipment.
- Justifying capital expenditure to a CFO or board. A line at 65% OEE but 30% TEEP has substantial capacity that can be unlocked by scheduling changes alone.
- Comparing your facility's total output potential against a competitor running 24/7.
- Conducting quarterly or annual capacity reviews.
Use both together when:
- Building a layered picture of performance for operations directors or regional VPs. OEE tells you how the equipment runs; TEEP tells you how much of the clock you are using.
- Deciding between adding shifts and buying new equipment. If TEEP is 30% and OEE is 70%, adding shifts is almost always cheaper than purchasing additional machinery.
- Integrating performance data into a manufacturing intelligence platform that feeds both operational dashboards and executive capacity reports.
Most plants track OEE as their primary daily KPI and review TEEP quarterly during capacity planning cycles. That cadence reflects the different decision speeds each metric serves.
For food manufacturers specifically, combining both metrics inside a single reporting system lets you connect equipment cycle data with staff input, downtime logs, and rework records, giving you a complete picture rather than a number without context. Gembalabs is built around exactly that model: sensor data from equipment cycles feeds into the same system as operator notes and shift results, so your OEE and TEEP figures carry the story behind them, not just the score.
What losses drive OEE and TEEP down
Understanding the loss structure behind each metric tells you where to focus improvement effort.
Losses captured by OEE (the six big losses, grouped into three categories):
- Availability losses: unplanned equipment breakdowns, changeover time that runs long, and startup delays after a planned stop.
- Performance losses: equipment running below its rated speed, minor stoppages that do not trigger a full downtime event, and idling between cycles.
- Quality losses: defects produced during stable running conditions, and startup rejects before the line reaches steady-state output.
Losses captured by TEEP but not OEE:
- Scheduling losses: hours when the plant is simply not staffed. Nights, weekends, holidays, and planned non-production days all appear here.
- Utilization losses: time when equipment is available but not scheduled for production, including extended planned maintenance windows and seasonal shutdowns.
TEEP includes both equipment losses and scheduling losses, while OEE captures only the equipment losses. That is why the two metrics serve different masters. A maintenance engineer working on breakdown reduction is working on OEE. A plant manager deciding whether to open a weekend shift is working on TEEP.
The business impact of each loss category differs sharply. Availability losses tend to be the most expensive per hour because they stop output entirely. Quality losses carry a double cost: wasted materials and the labor to rework or dispose of them. Scheduling losses are often the largest single contributor to a low TEEP, but they are a choice, not a failure. The question TEEP forces is whether that choice still makes sense given current demand.
How Gembalabs helps you track and act on both metrics
The most common mistake manufacturing teams make with these metrics is treating them as interchangeable. OEE used in a capital investment conversation produces the wrong answer. TEEP used as a daily operator target demoralizes teams for losses they cannot control.
Gembalabs addresses this by separating the data streams from the start. The platform collects raw equipment cycle data through sensors and combines it with human inputs: operator notes, downtime reasons, rework counts, and shift summaries. That combination is what makes the resulting OEE and TEEP figures meaningful rather than just mathematically correct.
The AI-generated reporting layer in Gembalabs is where the metric separation becomes practical. You can request a report focused on availability losses for a specific line, or a capacity utilization summary across your facility, and the system generates it from the same underlying data. No manual pivot tables, no spreadsheet reconciliation between what the machine logged and what the operator recorded.
Pro Tip: When reviewing TEEP in a capacity planning meeting, pull the scheduling decomposition alongside it. Gembalabs generates this automatically, showing what share of the TEEP gap comes from unscheduled time versus operational losses. That split determines whether your next move is a staffing conversation or a maintenance investment.
A small food manufacturer running two shifts can use Gembalabs to track OEE at the line level daily, then surface a TEEP summary monthly to assess whether demand growth warrants a third shift. The AI-driven production intelligence reports flag recurring downtime patterns and rework issues that erode OEE, while the utilization data feeds the TEEP picture. Both numbers come from the same system, so there is no version-of-truth problem when operations and finance sit down together.
Limitations and challenges in measuring OEE and TEEP accurately
Neither metric is self-executing. The quality of your OEE and TEEP figures depends entirely on the quality of the data feeding them, and that is where most plants run into trouble.
The most common data problem is inconsistent downtime categorization. If one operator logs a 15-minute jam as "unplanned downtime" and another logs the same event as "changeover," your Availability figure is wrong, and so is everything derived from it. Standardizing reason codes across shifts and lines is a prerequisite for reliable OEE, not an optional refinement.
TEEP introduces an additional complexity: defining "calendar time" consistently. Most formulas use 8,760 hours per year, but some plants exclude legally mandated shutdown periods or regulatory cleaning windows. If your Utilization denominator is not defined the same way across facilities, TEEP comparisons between them are meaningless.
Performance losses are chronically underreported. Minor stoppages under two minutes rarely get logged manually, yet they accumulate. A line that stops for 90 seconds every 20 minutes loses roughly 7% of its theoretical throughput before a single breakdown is recorded. Sensor-based monitoring catches these micro-losses; manual logging almost never does.
Finally, high OEE does not automatically mean profitability. A line running at 85% OEE on a product with poor margin contribution is not serving the business. OEE and TEEP measure equipment effectiveness, not financial performance. They belong in a broader decision framework alongside margin data, not as standalone success metrics.
Strategies to improve OEE and TEEP metrics
Improving OEE and improving TEEP require different interventions, and conflating them wastes effort.
To improve OEE, focus on the three loss categories:
- Reduce unplanned downtime through preventive maintenance schedules and faster fault diagnosis. Root cause analysis on recurring breakdown patterns is the fastest path to sustained Availability gains.
- Close the speed gap by auditing actual cycle times against rated speeds. Performance losses are often invisible until you put a sensor on the line and compare real throughput to theoretical throughput.
- Cut first-pass defect rates by tightening process controls at the points where quality losses cluster, typically startup and changeover transitions.
To improve TEEP, address scheduling and utilization:
- Evaluate whether adding a shift is feasible before committing to capital expenditure. A TEEP of 30–35% on a two-shift operation typically means a third shift could raise TEEP to around 45% without any new equipment.
- Reduce planned downtime windows by consolidating preventive maintenance into fewer, longer blocks rather than frequent short stops that consume scheduled hours.
- Use production tracking data to identify periods of scheduled but unproductive time, such as extended changeovers or cleaning cycles that could be compressed.
For both metrics together:
- Build a dashboard that displays OEE and TEEP side by side, with the Utilization figure shown explicitly. The three numbers together tell a complete story; any one of them alone invites misinterpretation.
- Standardize data collection across shifts so that the numbers are comparable over time. Improvement you cannot measure reliably is improvement you cannot sustain.
- Align metric review cadence to decision cadence. OEE belongs in daily shift reviews. TEEP belongs in monthly or quarterly capacity meetings, not on a shift board where operators have no control over scheduling.
Key Takeaways
OEE measures operational effectiveness during scheduled time; TEEP measures total capacity utilization against all calendar hours, and the gap between them is your capacity expansion opportunity.
| Point | Details |
|---|---|
| Different time bases, different decisions | OEE uses planned production time; TEEP uses all 8,760 calendar hours per year. |
| TEEP is always lower than OEE | TEEP = OEE × Utilization, and Utilization is always less than 100%. |
| Mid-market benchmarks differ sharply | Mid-market OEE runs around 60%; mid-market TEEP for two-shift operations runs 30–35%. |
| Match the metric to the decision | Use OEE for daily operational control; use TEEP for capacity planning and capital investment. |
| Data quality determines metric quality | Inconsistent downtime logging and undefined calendar-time denominators make both metrics unreliable. |

Gembalabs collects equipment cycle data and staff inputs in one place, then uses AI to generate OEE and TEEP reports tailored to the questions your team is actually asking. Whether you need a shift-level Availability breakdown or a quarterly capacity utilization summary, the data is already there. See how it works at Gembalabs manufacturing intelligence.