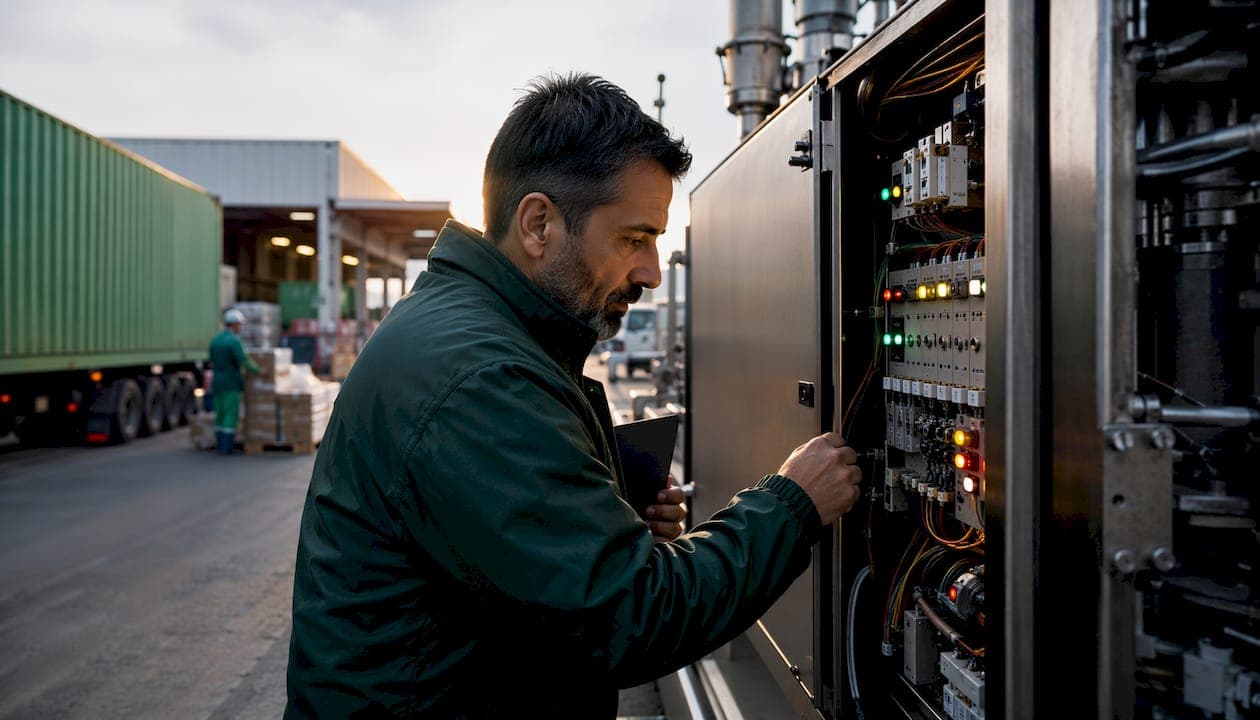
Real-time equipment monitoring is the continual capture and analysis of live machine data to minimize downtime and improve production performance in food manufacturing environments. Plants that adopt this approach report 10–15% productivity gains and reduce unplanned downtime by up to 50%. Modern dashboards refresh every 15–60 seconds, cutting response time from hours to minutes. The industry term for this practice is continuous condition monitoring, and it sits at the intersection of IIoT sensor networks, OPC-UA data protocols, and AI-powered analytics. Gembalabs brings all three together in a single platform built specifically for small and mid-sized food manufacturers.
What does real-time equipment monitoring require to get started?
The foundation of any live equipment monitoring system is data. Effective monitoring integrates PLCs, IoT sensors, CMMS records, and operator mobile inputs into a unified live dashboard. Each source adds a different layer: PLCs capture machine cycle data, IoT sensors track temperature and vibration, CMMS logs maintenance history, and operator inputs record downtime causes and rework events. Combining these streams gives you a complete picture of what is actually happening on the floor.
Hardware and connectivity prerequisites
Three integration protocols handle the majority of food manufacturing environments: OPC-UA for PLC communication, MQTT for lightweight IoT sensor data, and REST APIs for connecting ERP or CMMS systems. You do not need to replace existing control hardware. Most facilities connect directly to existing machine signals and use lightweight dashboards, avoiding large MES rollouts entirely. That approach gets critical assets live in under five days.
Sensor selection for rotating equipment
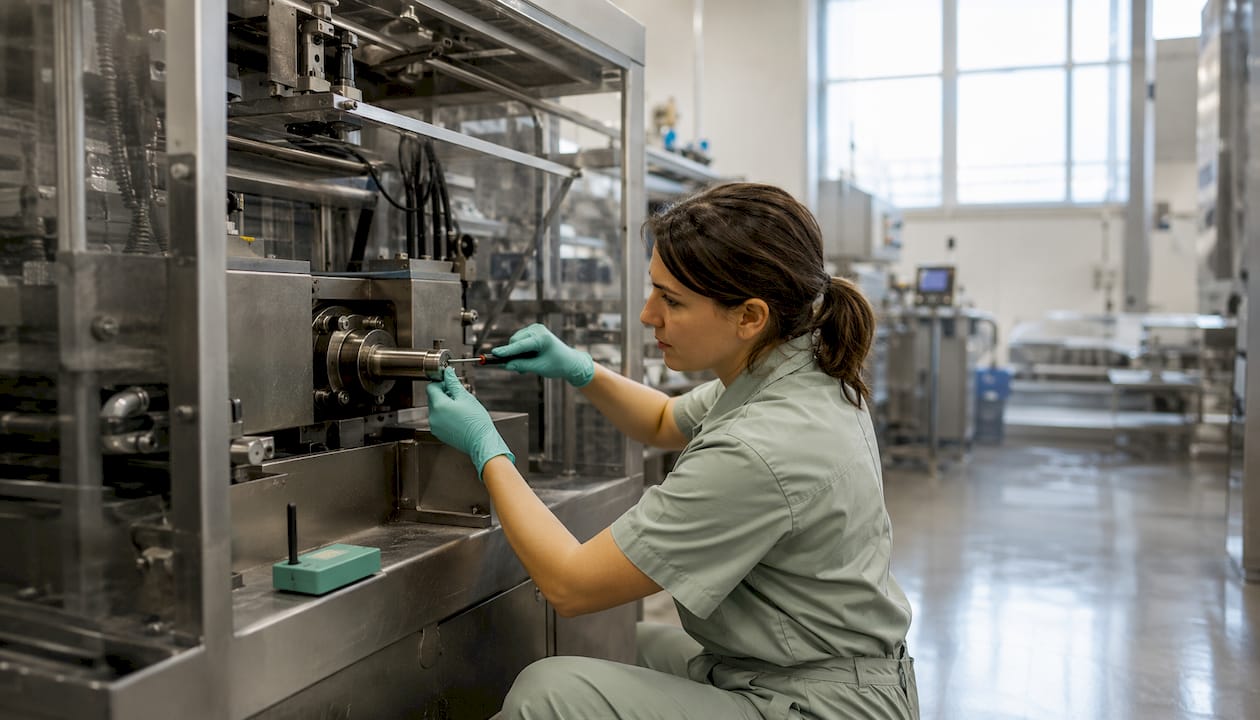
Sensor choice matters more than most teams realize. Multi-sensor approaches using ultrasound alongside vibration and temperature give earlier detection for rotating equipment failures. Ultrasound detects bearing faults weeks before vibration data shows any anomaly. For food manufacturing, where conveyors, mixers, and filling lines run continuously, that lead time is the difference between a planned replacement and an emergency shutdown.
Key prerequisites before go-live:
- Identify your top 10 highest-impact assets by downtime cost or food safety risk.
- Confirm network coverage (wired or Wi-Fi) at each asset location.
- Map existing PLC outputs and confirm OPC-UA or MQTT compatibility.
- Assign an IT/OT liaison to manage firewall rules and data routing.
- Define alert thresholds for each asset class before the first sensor goes live.
Pro Tip: Start with your packaging line or filler, not your entire facility. A single high-value asset generates enough data to prove ROI in the first week and builds team confidence before you scale.
How do you set up a real-time monitoring system step by step?
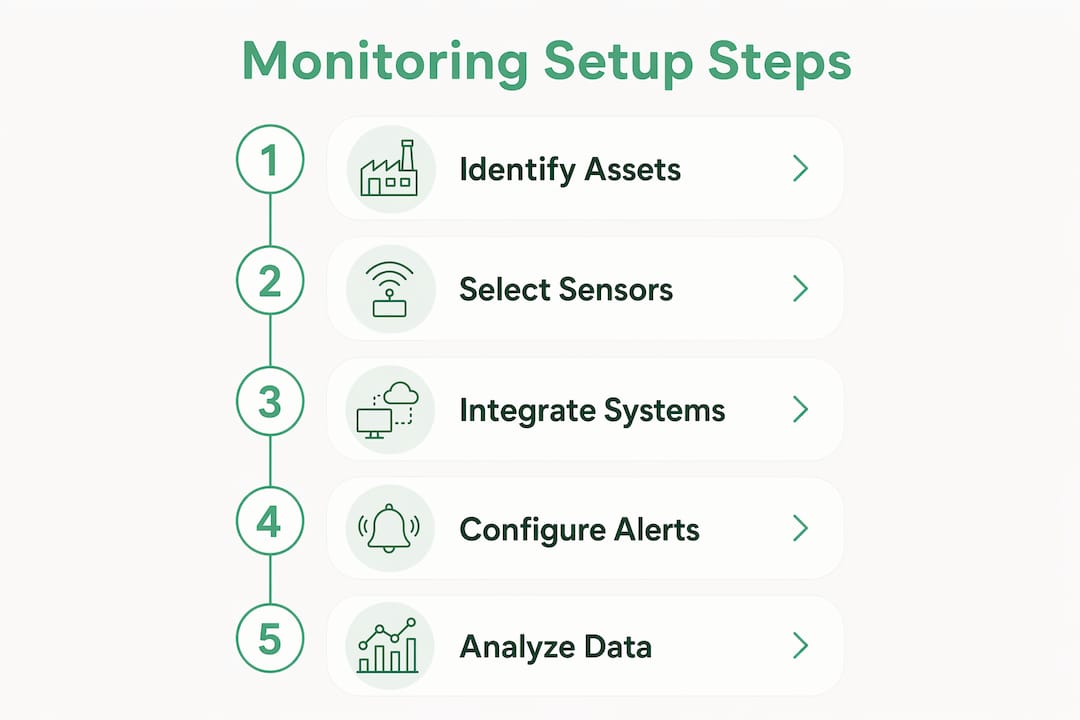
A structured deployment prevents the two most common failures: scope creep and alert overload. Follow this sequence to go from zero visibility to a live equipment tracking system without disrupting production.
-
Conduct an asset criticality assessment. Rank every machine by the cost of one hour of unplanned downtime. Food safety equipment, such as pasteurizers and CCP-linked conveyors, always ranks first. This list becomes your deployment priority order.
-
Install sensors and establish baseline data. Mount vibration, temperature, and ultrasound sensors on priority assets. Run the system in observation mode for 5–7 days to capture normal operating ranges. Baseline data is the reference point every future alert compares against.
-
Configure your dashboard and alert rules. Build one dashboard per production area, not one massive screen. Set alert thresholds at 10–15% above baseline for non-critical assets and tighter bands for food safety equipment. Route alerts to the right person: maintenance gets vibration anomalies, production supervisors get throughput drops.
-
Integrate with existing workflows. Connect the monitoring platform to your CMMS so alerts automatically generate work orders. Link it to your ERP for parts inventory checks. This step is where monitoring systems go beyond dashboards by automatically generating service tickets and ordering parts when issues arise.
-
Train maintenance and production teams. Run two separate training sessions: one for maintenance technicians focused on alert interpretation, and one for production supervisors focused on throughput and OEE dashboards. Each group needs a different view of the same data.
-
Review and refine after 30 days. Pull your first month of alert data. Identify which alerts triggered action and which were ignored. Adjust thresholds accordingly. This refinement cycle is what separates a useful monitoring system from a noisy one.
Pro Tip: Avoid the temptation to monitor everything at once. A focused deployment on five assets with tight alert rules outperforms a facility-wide rollout with loose thresholds every time.
The daily production report your supervisors already generate becomes far more accurate when it pulls from live sensor data rather than manual operator logs.
What are the most common real-time monitoring deployment challenges?
Deployment problems in food manufacturing fall into three categories: data overload, legacy connectivity, and misaligned expectations about what AI can do without human input.
Alert fatigue is the most common failure mode. When every sensor deviation triggers a notification, operators stop responding to alerts entirely. Combining automated AI fault detection with expert human validation prevents alert fatigue and keeps maintenance responses actionable. The fix is a tiered alert structure: critical alerts go to a phone call, warnings go to a dashboard flag, and informational events log silently for weekly review.
Legacy equipment creates connectivity gaps. Machines older than 15 years often lack digital outputs. The practical solution is to add external sensors directly to the machine housing rather than trying to tap into the control system. Vibration and temperature sensors require no machine modification and work on equipment from any era.
Real-time monitoring does not replace the reliability engineer. It gives that engineer 10 times more data to work with, so their decisions are faster and more accurate. The human judgment layer is what converts raw sensor data into a maintenance decision that actually gets executed.
Overestimating AI autonomy creates trust problems. AI-powered anomaly detection flags patterns that humans would miss, but it also generates false positives. Eliminating visibility lag is the core value of real-time monitoring. The AI prioritizes what to look at; the human decides what to do. Teams that skip the human validation step end up with a system nobody trusts.
Tips for a reliable deployment:
- Set a maximum of three alert types per asset: critical, warning, and informational.
- Assign a named owner to every alert category before go-live.
- Review false positive rates weekly for the first 60 days.
- Use root cause analysis protocols to close the loop on every critical alert.
How do you measure and act on real-time monitoring outputs?
The goal of equipment performance analysis is not a better dashboard. The goal is a measurable reduction in unplanned downtime and a measurable increase in throughput. Four KPIs tell that story clearly.
Overall Equipment Effectiveness (OEE) combines availability, performance, and quality into a single score. A baseline OEE reading in the first month gives you the benchmark every future improvement is measured against. Most food manufacturers find their initial OEE is 10–20 points lower than they estimated from manual records alone.
Uptime percentage tracks how often each asset runs versus its scheduled production time. Live machine monitoring makes this number accurate for the first time. Manual logs undercount downtime because operators often absorb short stops without recording them.
Defect rate and rework volume connect equipment condition to product quality. A filler running at the wrong speed creates overfill or underfill. A mixer with a worn bearing produces inconsistent batch texture. Linking sensor data to quality records reveals these connections automatically.
Maintenance response time measures how quickly the team acts after an alert fires. AI predicts anomalies 2–4 weeks before failure and runs automated root cause analysis to speed troubleshooting. That lead time converts emergency repairs into scheduled maintenance, which costs a fraction of the price.
The action layer closes the loop. When a vibration threshold is crossed, the system creates a CMMS work order, checks parts inventory, and notifies the technician. The production supervisor sees a throughput alert on their dashboard at the same moment. Response time drops from hours to minutes without any manual coordination.
Gembalabs combines raw equipment cycle data with operator-entered downtime and rework records to produce this kind of integrated view. The platform's AI then generates reports on the specific metrics you want to track, whether that is OEE by shift, downtime by asset, or rework rate by product line. You can explore how Gembalabs intelligence works to see how these data streams connect in practice.
Key Takeaways
Real-time equipment monitoring delivers measurable gains only when sensor data, human validation, and automated workflows operate together as a single system.
| Point | Details |
|---|---|
| Start with critical assets | Rank machines by downtime cost and deploy sensors on the top five first. |
| Integrate all data sources | Connect PLCs, IoT sensors, CMMS, and operator inputs for a complete production view. |
| Use tiered alert rules | Limit each asset to three alert types to prevent fatigue and maintain operator trust. |
| Measure OEE from day one | Baseline OEE in the first month gives you the benchmark every future improvement is measured against. |
| Close the loop with automation | Configure alerts to auto-generate work orders and parts requests so response time drops from hours to minutes. |
What I've learned from watching food plants deploy live monitoring
The facilities that get the fastest ROI from continuous condition monitoring share one trait: they treat the first deployment as a learning exercise, not a finished system. They pick five assets, run tight alert rules, and spend the first 30 days figuring out what the data actually means in their specific environment. The facilities that struggle try to monitor everything at once and end up with a dashboard nobody checks.
The second pattern I've noticed is that the human reliability engineer becomes more valuable after deployment, not less. AI-powered anomaly detection surfaces problems that would never appear in a weekly maintenance walk. But the engineer is still the one who decides whether a vibration spike means a bearing is failing or a product changeover caused a temporary imbalance. The technology extends human judgment; it does not replace it.
The future of this space is the action layer. Right now, most systems alert and display. The next step is a platform that automatically creates work orders and manages parts procurement the moment a threshold is crossed. Food manufacturers who build that workflow now will have a significant operational advantage when AI prescriptive maintenance becomes the industry standard.
My advice for teams just starting: resist the urge to buy the most feature-rich platform available. Buy the one your maintenance team will actually use. A simple dashboard with reliable alerts and a direct CMMS connection beats a complex system that requires a data scientist to interpret.
— Trevor
How Gembalabs supports fast monitoring deployment for food manufacturers
Food manufacturers running on tight margins cannot afford a six-month software rollout.
Gembalabs is built for small and mid-sized food manufacturers who need live visibility into equipment and staff performance without a long implementation timeline. The platform pulls raw equipment cycle data alongside operator-entered downtime and rework records, then combines them into a single view of your facility. Its AI generates reports on the specific metrics you care about, from OEE by shift to defect rate by product line. You can connect existing PLCs, IoT sensors, and CMMS records without replacing your current infrastructure. See how the Gembalabs platform fits your operation and book a demo to get your first assets live in under a week.
FAQ
What is real-time equipment monitoring in food manufacturing?
Real-time equipment monitoring is the continuous capture and analysis of live machine data, including sensor readings, cycle counts, and operator inputs, to detect faults and track production performance as they happen.
How quickly can a monitoring system go live?
Critical assets can go live in under five days when you connect directly to existing machine signals and use a lightweight dashboard without a full MES rollout.
What KPIs should food manufacturers track first?
Start with OEE, uptime percentage, and maintenance response time. These three metrics reveal availability losses, hidden downtime, and how fast your team acts on alerts.
How does AI improve equipment monitoring accuracy?
AI detects anomalies 2–4 weeks before failure and runs automated root cause analysis, but human validation remains necessary to filter false positives and confirm maintenance decisions.
What causes alert fatigue and how do you fix it?
Alert fatigue happens when too many notifications fire without clear priority. Limit each asset to three alert tiers, assign a named owner to each tier, and review false positive rates weekly for the first 60 days.