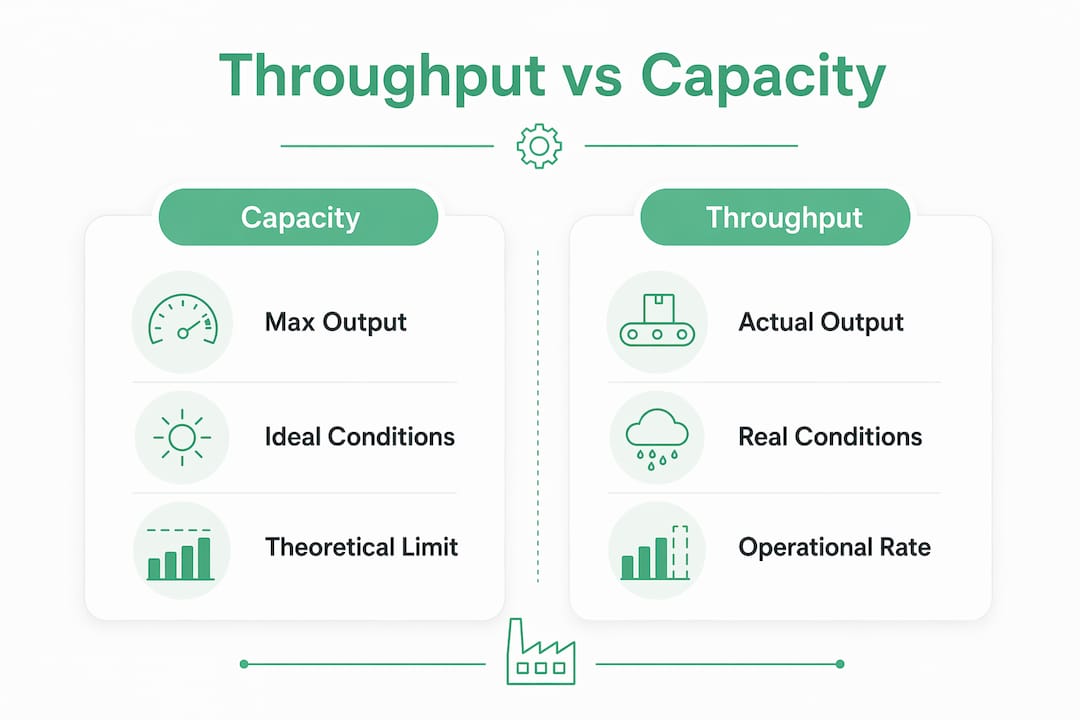
Throughput is defined as the actual rate at which a production line delivers finished, compliant goods over a set time period. Capacity, by contrast, is the maximum sustainable output that same line could achieve under ideal conditions. The gap between the two is where most food manufacturers lose money, miss orders, and burn out equipment. Understanding throughput vs capacity is not an academic exercise. It is the foundation of every meaningful production decision you make, from scheduling shifts to justifying capital investment.
What is the difference between throughput and capacity?
Capacity is the maximum sustainable output rate of a system under ideal conditions, measured in units per hour or per shift. Throughput is the actual achieved output rate of finished, compliant goods over that same period. Capacity represents what your line could do. Throughput represents what it actually does.
The difference matters because most production managers plan against capacity, then wonder why their lines fall short. A packaging line rated at 1,200 units per hour rarely delivers 1,200 units per hour. Sanitation windows, changeovers, minor stoppages, and operator variability all chip away at that number before the shift ends.
Gross throughput includes all units produced, including scrap and rework. Net throughput counts only conforming, finished goods. Focusing on gross throughput masks quality problems that quietly inflate your cost per unit. For food manufacturers, net throughput is the only number that truly reflects production health.
Pro Tip: Track net throughput by shift, not just total daily output. Shift-level data reveals patterns in operator performance and equipment behavior that daily totals hide completely.
Why does throughput fall short of capacity?
Several factors create the gap between what a line can do and what it actually delivers.
- Bottleneck constraints. System throughput cannot exceed the capacity of the slowest process step. If your filler runs at 800 units per hour but your labeler maxes out at 650, your line throughput is 650, regardless of every other station's speed.
- Unplanned downtime. Equipment failures, ingredient shortages, and sanitation holds reduce available run time directly.
- Changeovers and cleaning. In food manufacturing, sanitation requirements are non-negotiable. Every cleaning cycle is time your line is not producing.
- Quality rejects. Units pulled for rework or disposal reduce net throughput even when the line appears to be running at full speed.
- High utilization. Operating above 85–90% capacity causes exponential increases in queue times and flow time. The line looks busy, but actual output per hour drops.
Effective capacity accounts for real-world losses like downtime, changeovers, cleaning, and operator variability. It is typically 20–40% lower than the theoretical maximum. That gap is not a failure. It is the realistic ceiling your planning should target.
Pro Tip: Use your effective capacity, not your nameplate capacity, as the baseline for production scheduling. Planning to nameplate guarantees you will miss targets every week.
How do you calculate throughput and capacity?
Accurate measurement starts with two straightforward formulas, then gets more precise from there.
- Throughput = Units produced ÷ Time elapsed
- Capacity = Maximum units possible ÷ Same time period
- Effective capacity = Theoretical capacity × OEE (Overall Equipment Effectiveness)
- OEE = Availability × Performance × Quality
- Net throughput = Gross units produced × First Pass Yield (FPY)
Throughput equals the inverse of mean cycle time: TH = 1 ÷ cycle time. This reciprocal relationship lets you convert time-based equipment data directly into units per hour, which is the format most useful for production planning.
OEE is the most practical bridge between theoretical capacity and real throughput. A line with 90% availability, 95% performance, and 98% quality delivers an OEE of roughly 84%. Apply that to a 1,200-unit-per-hour nameplate capacity and your effective throughput target becomes approximately 1,008 units per hour. That is the number worth planning around.
First Pass Yield measures the percentage of units that pass quality checks without rework on the first attempt. A low FPY means your gross throughput looks acceptable while your net throughput quietly suffers. In food production, where rework often means repackaging or disposal, FPY directly affects your cost of goods.
Little's Law provides a useful consistency check: WIP = Throughput × Flow time. If your work-in-process inventory is growing while throughput stays flat, flow time is increasing. That signals batching issues, unplanned stoppages, or a bottleneck you have not yet identified.
| Metric | Formula | What it tells you |
|---|---|---|
| Throughput | Units produced ÷ Time | Actual output rate |
| Capacity | Max units ÷ Time | Theoretical ceiling |
| Effective capacity | Theoretical capacity × OEE | Realistic planning target |
| Net throughput | Gross units × FPY | Compliant output only |
| Cycle time | 1 ÷ Throughput | Time per unit at current rate |
How do bottlenecks control your line's throughput?
The bottleneck station defines the maximum throughput of the entire system. No other improvement changes that fact until you address the bottleneck directly.
Improving non-bottleneck stations does not raise overall throughput. It raises work-in-process inventory and operating costs. A faster filler feeding a slow labeler just creates a pile of product waiting in queue. The line's output per hour does not move.
This is the most expensive misconception in food manufacturing. Production managers invest in faster mixers, newer conveyors, and upgraded packaging equipment, then find their throughput unchanged. The bottleneck absorbed every gain and gave nothing back.
Identifying the bottleneck requires comparing per-step capacity and actual throughput across every station in the line. The step where WIP accumulates upstream is almost always the constraint. Once identified, the path forward is clear: reduce its downtime, reduce its cycle time, or add parallel capacity at that specific step.
- Protect the bottleneck. Never let the constraint station sit idle waiting for upstream supply. Buffer inventory just before the bottleneck keeps it running continuously.
- Subordinate everything else. Pace upstream stations to feed the bottleneck steadily, not faster than it can absorb.
- Elevate the constraint. Once you have protected and subordinated, invest in increasing the bottleneck's capacity through maintenance, process improvement, or equipment.
Pro Tip: Map your line's per-station cycle times before any capital investment discussion. A $15,000 maintenance overhaul on the bottleneck station often delivers more throughput gain than a $200,000 equipment upgrade elsewhere.
Practical strategies to raise throughput within your capacity limits
Throughput optimization prioritizes flow and quality rather than maximum utilization. Running equipment at 100% utilization consistently causes more downtime and lowers net output over time.
The most effective approach combines four practices.
- Reduce variability. Inconsistent ingredient weights, temperature fluctuations, and operator technique variation all create micro-stoppages and quality rejects. Standardizing work procedures at each station reduces this variability directly. A standard work guide for each process step gives operators a repeatable baseline to work from.
- Cut changeover time. Every minute saved on a product changeover is a minute of productive run time added back. Apply SMED (Single-Minute Exchange of Die) principles to your changeover procedures, separating internal tasks from external ones.
- Control quality at the source. Catching defects at the point of creation costs far less than catching them at final inspection. Inline quality checks reduce rework volume and protect net throughput.
- Monitor in real time. Throughput analysis only works when data is current. Reviewing yesterday's numbers tells you what went wrong. Reviewing live data lets you act before the shift ends.
Utilization over 90% causes queue times to grow exponentially. Manufacturing best practices recommend keeping utilization below this threshold to protect throughput and flow. The counterintuitive truth is that a line running at 85% utilization often delivers higher net throughput than the same line pushed to 100%, because quality and flow time both improve.
Gembalabs tracks equipment cycle data alongside human factors like downtime events and rework volumes. That combination gives production managers a clear picture of where throughput is being lost and why, without requiring manual data collection or end-of-shift guesswork. You can see how Gembalabs works to connect equipment performance with staff behavior in a single view.
Pro Tip: Set a utilization ceiling of 85% for your bottleneck station during planning. The buffer absorbs variability without letting queue times spiral. Your on-time delivery rate will improve before anything else does.
Key takeaways
Capacity sets the ceiling; throughput measures what you actually clear. Closing the gap between the two requires targeting your bottleneck, controlling quality, and keeping utilization below the threshold where delays compound.
| Point | Details |
|---|---|
| Capacity vs. throughput | Capacity is the theoretical maximum; throughput is actual compliant output per hour. |
| Bottleneck controls output | No improvement to non-bottleneck stations raises overall throughput. |
| Effective capacity is lower | Real-world losses reduce effective capacity by 20–40% below nameplate figures. |
| Net throughput is what counts | Gross output minus scrap and rework gives the only number that reflects true production value. |
| Utilization has a ceiling | Pushing above 85–90% utilization increases delays and reduces net throughput. |
Why most food manufacturers measure the wrong number
I have spent years watching production teams celebrate hitting their daily unit count, then lose margin to rework costs they never tracked. The number on the whiteboard was gross throughput. The number that mattered was net throughput, and nobody was watching it.
The deeper problem is that capacity gets treated as a goal rather than a constraint. When a line is rated at 1,200 units per hour, the instinct is to push toward that number. But that rating assumes zero downtime, zero quality loss, and zero variability. None of those assumptions hold in a real food facility. Chasing nameplate capacity is how you burn out equipment and frustrate operators.
What actually works is accepting that effective capacity is your real ceiling, finding the one station that limits your throughput, and making that station the center of every improvement effort. Everything else is noise. A root cause analysis focused on your bottleneck station will deliver more measurable throughput gain than any broad efficiency initiative.
The teams that consistently hit their production targets are not the ones running the hardest. They are the ones measuring the right things, protecting their bottleneck, and keeping utilization at a level where quality stays intact. That discipline is harder to maintain than it sounds, but the data makes it easier.
— Trevor
How Gembalabs helps you close the throughput gap
Production managers need more than end-of-day reports to act on throughput problems. They need data that connects equipment performance to human factors in real time.
Gembalabs collects raw equipment cycle data alongside staff-reported downtime, rework events, and quality flags, then combines them into a single production intelligence view. The platform's AI generates reports on the specific metrics you want to track, whether that is bottleneck utilization, shift-level net throughput, or FPY trends over time. For small and mid-sized food manufacturers, that level of visibility used to require enterprise-scale investment. Gembalabs brings it within reach. See what Gembalabs tracks and how it applies to your facility.
FAQ
What is the simplest definition of throughput vs capacity?
Capacity is the maximum output a system can produce under ideal conditions. Throughput is the actual rate of finished, compliant goods produced over a given time period.
Why is my throughput always lower than my capacity?
Real-world factors including downtime, changeovers, sanitation, quality rejects, and operator variability reduce effective output. Effective capacity is typically 20–40% below theoretical maximum capacity.
How do I calculate throughput in food manufacturing?
Divide total compliant units produced by the time elapsed. For greater accuracy, multiply gross units by your First Pass Yield to get net throughput, which excludes rework and scrap.
What is the relationship between bottlenecks and throughput?
The bottleneck station sets the maximum throughput for the entire line. Improving any other station does not raise overall output. It only increases work-in-process inventory upstream of the constraint.
Should I run my line at full capacity to maximize throughput?
No. Operating above 85–90% utilization causes queue times and delays to grow exponentially, which reduces net throughput. Keeping utilization below that threshold protects both flow and quality.