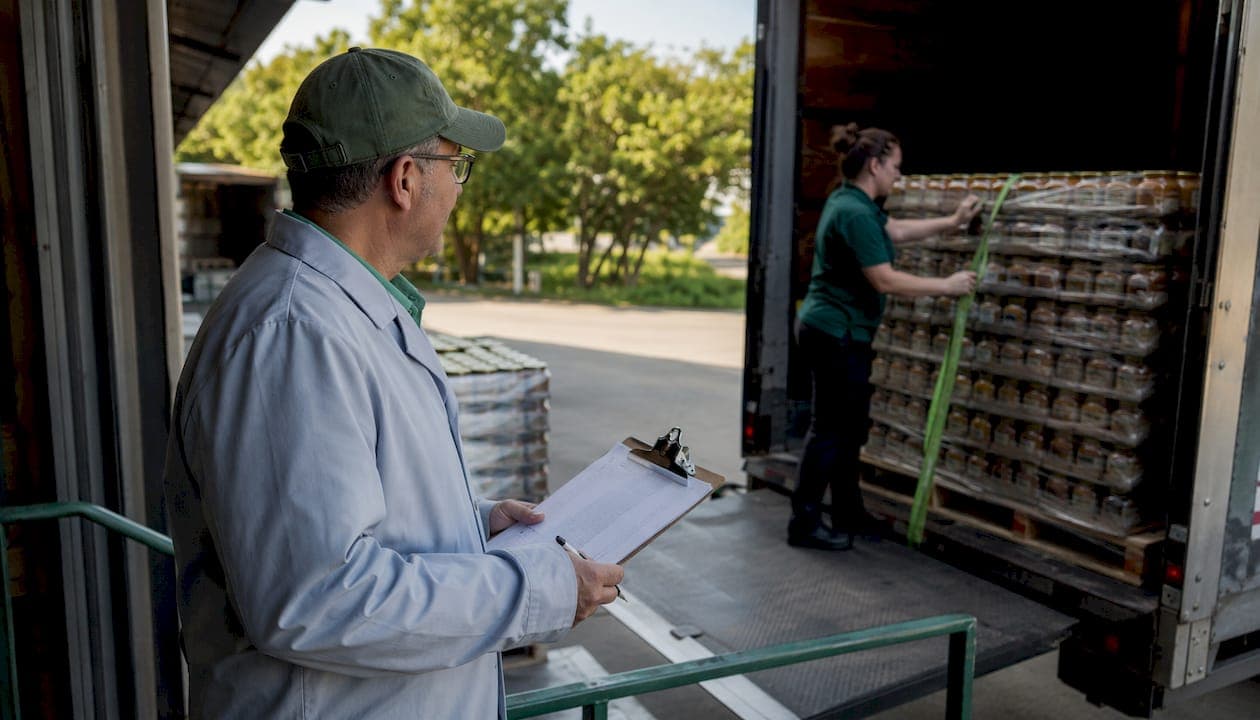
First Pass Yield (FPY) measures the percentage of units that complete a production step correctly the first time, without rework, reprocessing, or rejection. The formula is straightforward: FPY = (Good units without rework ÷ Total units started) × 100. For food manufacturers, a plant running at 90% FPY with a high final yield may be spending a significant portion of its production capacity on rework and hidden losses that never appear on a finished-goods report.
That gap is where scheduling falls apart and costs accumulate. Rework batches compete with new production for oven time, filler capacity, and labor. Scrap that gets quietly absorbed into waste figures distorts your true cost-per-unit. And when FPY is not tracked at the batch or SKU level, managers make scheduling decisions based on assumed yield rather than verified output.
FPY callout: A plant with 90% FPY and 98% final yield is running a hidden rework factory consuming roughly 8% of capacity — capacity that could be producing saleable product.
World-class food lines typically target high FPY levels per station. Most facilities starting structured measurement find their actual baseline below that, which means the opportunity is real and the payoff from closing that gap is immediate.
Table of Contents
- How does FPY differ from RTY, throughput yield, and OEE quality?
- How do you calculate FPY step by step for a food production batch?
- What causes low FPY on food production lines?
- How do you measure and track FPY accurately in a food facility?
- What are the most effective ways to improve FPY on food lines?
- How does software help you measure and improve FPY?
- How do you set FPY targets and build a monitoring process?
- Worked example: the cost impact of a 3-point FPY improvement
- Key Takeaways
- The number your facility is probably not tracking
- Gembalabs gives your facility batch-level FPY visibility from day one
- Useful sources and further reading
How does FPY differ from RTY, throughput yield, and OEE quality?
FPY is a station-level or batch-level metric. It tells you what happened at one step. That precision is exactly what makes it useful for diagnosis, and exactly what makes it insufficient on its own for a multi-station line.
Rolled Throughput Yield (RTY) compounds the FPY of every station in sequence. If your mixing station runs at a high FPY and your filling station runs similarly, your RTY for those two stations is the product of those FPYs. Additional stations multiply this effect, causing line-level RTY to drop significantly if per-station FPYs are less than optimal. The math is unforgiving, and it explains why small per-station improvements produce outsized line-level results.
Throughput yield is essentially the same concept as FPY applied at a single process step. The terms are often used interchangeably in food manufacturing.
OEE Quality (the quality component of Overall Equipment Effectiveness) measures the ratio of good units to total units produced, including speed losses and availability. It is a machine-centric view, not a process-quality view.
- Use FPY when you need to isolate rework and defect rates at a specific station, batch, or SKU.
- Use RTY when you need to understand cumulative quality loss across a multi-step line.
- Use OEE Quality when the question is about machine performance and capacity utilization.
- Pair FPY + RTY for multi-station diagnosis; pair FPY + OEE when you need to understand the capacity-versus-quality trade-off at a specific piece of equipment.
How do you calculate FPY step by step for a food production batch?
Calculating FPY accurately starts with defining your process boundary. In food manufacturing, "started" means the number of units (or kilograms, or cases) that entered the process step. "Good without rework" means units that passed inspection and moved forward without any reprocessing, trimming, reformulation, or relabeling. A unit that was reworked and ultimately sold is still an FPY loss.

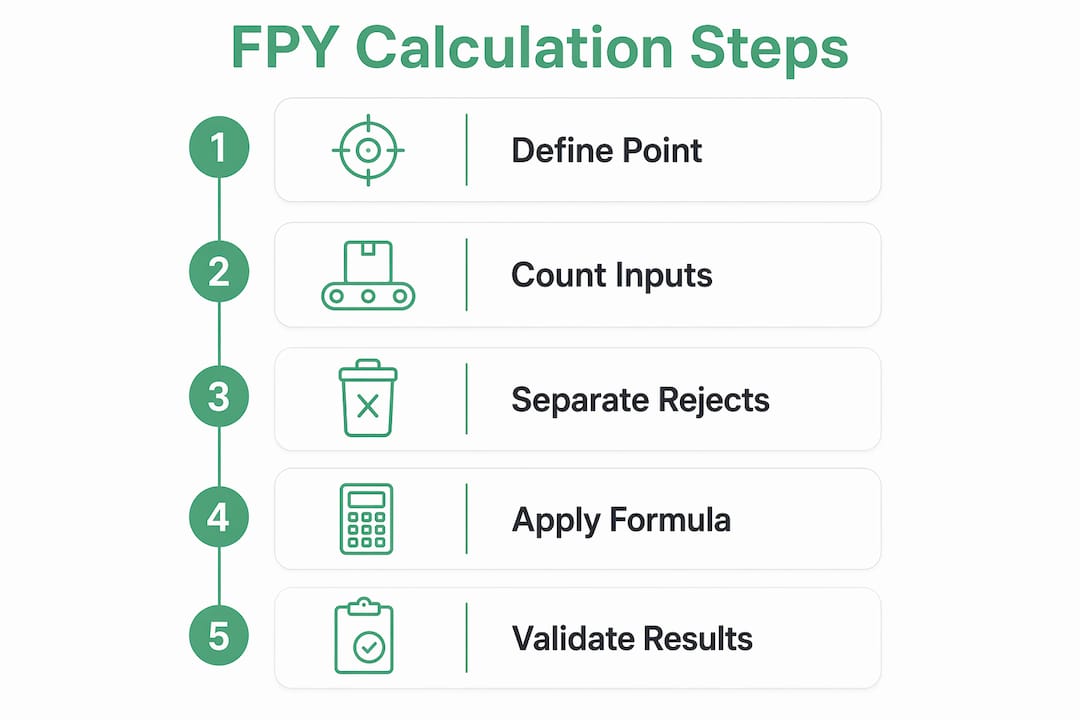
Step 1: Define the inspection point. Pick a single, consistent checkpoint — end of filling, end of cooking, end of packaging. Mixing inspection points across shifts or operators is the most common source of unreliable FPY data.
Step 2: Count inputs. Record the total units or weight entering the step. Use the batch record, not the production order quantity, since actual inputs often differ from planned.
Step 3: Count rejects and rework separately. Rejects leave the line. Rework re-enters it. Both reduce FPY. Combining them into a single "defect" count is a measurement error.
Step 4: Apply the formula. Good units = Total started minus rejects minus rework. FPY = Good units ÷ Total started × 100.
Step 5: Validate. Reconcile output weight against input weight using your BOM yield percentage. Flag batches where the two diverge by more than your tolerance threshold.
Worked example: sauce filling line
| Metric | Value |
|---|---|
| Units entered filling station | 1,000 jars |
| Rework (relabeled, refilled) | 25 jars |
| Good units (no rework) | 940 jars |
| FPY | 94.0% |
The 940 good jars divided by 1,000 started gives 94.0% FPY. The 25 rework jars consumed filler time, labor, and packaging materials — costs that do not appear in the final yield figure of 96.5% (965 saleable units ÷ 1,000 started).
Validation checks to run on every batch:
- Weigh reconciliation: does output weight plus scrap weight equal input weight within tolerance?
- Inspection timestamps: are reject counts timestamped so you can correlate spikes with shift changes or equipment events?
- Audit sample: pull a small fraction of "good" units for a secondary check to confirm the inspection gate is calibrated.
What causes low FPY on food production lines?
Many FPY losses on food lines trace back to several common root categories. Knowing which one is active saves hours of misdirected troubleshooting.
-
Process drift (temperature, moisture, cook time): Recipe parameters wander outside spec during a shift. A filling temperature that drops 3°C can change viscosity enough to cause underfills. Check: pull the last 20 batch records and plot the key process parameter against FPY. Correlation is usually visible immediately.
-
Equipment variability: Worn seals, miscalibrated fillers, and inconsistent conveyor speeds all introduce unit-to-unit variation. A filler that ran at 99% FPY last quarter may be at 93% today because a nozzle is partially blocked. Check: compare FPY by machine ID, not just by line.
-
Incoming ingredient variance: Fat content, moisture, and particle size in raw materials shift between suppliers and even between deliveries. A batch of flour with 1.5% higher moisture than spec can push a baked product outside weight tolerance. Check: cross-reference FPY dips against goods-received dates and supplier lot numbers.
-
Operator errors: Incorrect setup, skipped checks, and inconsistent manual portioning are the most variable cause and the hardest to see in aggregate data. Standard work protocols reduce this variance significantly.
-
Packaging and labeling issues: Wrong label, misaligned seal, incorrect date code. These failures often happen at the end of the line and disproportionately affect FPY because the unit has already consumed all upstream processing cost.
-
Measurement errors (weigh scales, inspection gates): A scale that drifts 2 grams over a shift will misclassify good units as rejects and inflate apparent FPY loss. Check: verify scale calibration at shift start and end, not just weekly.
Pro Tip: The fastest way to identify whether your FPY problem is equipment-driven or operator-driven is to compare FPY on the same line across different shifts running the same SKU. If FPY varies significantly by shift but not by time-of-day, the root cause is human. If it varies by time-of-day but not by shift, look at equipment warm-up or ingredient temperature.
How do you measure and track FPY accurately in a food facility?
Batch-level recording is the foundation. Without per-SKU, per-batch reconciliation of inputs, outputs, scrap, and rework, your FPY numbers are estimates at best. Estimates do not support corrective action, and they do not hold up in a food safety audit.
Data sources to capture for every batch
| Data Point | Why It Matters for FPY |
|---|---|
| Raw material issued (kg or units) | Establishes the true input denominator |
| BOM target yield % | Flags when actual yield deviates from standard |
| Finished output (units or kg) | Numerator for yield calculation |
| Scrap (weight and reason code) | Separates process loss from defect loss |
| Rework count and reason code | Exposes hidden factory capacity consumption |
| Giveaway (overfill weight) | Reveals cost loss not captured in reject counts |
| Weight check results | Validates inspection gate accuracy |
| Operator notes and timestamps | Connects FPY events to specific actions or conditions |
Connecting production output, input usage, recipe variance, and cost impact in the same data model is what turns yield data into decisions. A spreadsheet that captures only finished units misses the rework loop entirely.
Common measurement pitfalls:
- Misaligned process boundaries: One shift counts rework at the filler; another counts it at packaging. The FPY numbers are incomparable.
- Hidden rework in the "repair area": Units pulled off the line for relabeling or reweighing often never appear in the batch record. They just reappear as finished goods.
- Inconsistent defect definitions: "Underfill" means different things to different inspectors. Without a written standard and a photo reference, defect counts drift.
Checklist for consistent FPY measurement:
- Standardize BOM yield % per SKU and review quarterly
- Assign batch IDs that link to raw material lots, equipment IDs, and shift records
- Timestamp every inspection event (not just end-of-batch totals)
- Set variance alerts for batches where actual yield deviates from BOM yield by more than your threshold
- Run a monthly audit: pull five batches and verify the paper record against physical weigh reconciliation
First Article Inspection (FAI) is the critical early gate. Automated checks for fill weight, label placement, and seal integrity before full batch release prevent defects from scaling across hundreds of units. One missed FAI failure on a 2,000-unit batch can drop your shift FPY by several points in a single event.
What are the most effective ways to improve FPY on food lines?
The highest-impact improvements are almost never the most expensive ones. Start with the actions that reduce variation before investing in automation.
30-day quick wins
- Standardize inspection definitions. Write a one-page defect standard with photos for your top three defect types. Inconsistent defect counting is the fastest way to generate FPY data that misleads rather than guides.
- Implement shift-start equipment checks. A five-minute checklist covering filler nozzle condition, scale calibration, and seal temperature catches the majority of equipment-driven FPY losses before they produce rejects.
- Add a daily FPY review to shift handover. Five minutes of structured review at shift change, with the outgoing operator presenting FPY and top loss reason, creates accountability without adding overhead.
- Tag rework separately from scrap in your batch record. If rework and scrap are combined in one "defect" field, you cannot distinguish a process problem from a capacity problem.
90-day medium-term actions
- Deploy Statistical Process Control (SPC) on your top two critical control points. Control charts on fill weight and cook temperature catch drift before it produces defects. SPC does not require expensive software; a shared spreadsheet with control limits works at this stage.
- Implement a preventive maintenance schedule tied to FPY data. If your filler's FPY drops predictably every 6 weeks, that is a maintenance interval signal. Equipment performance monitoring that correlates maintenance events with yield dips makes the case for PM investment in terms management understands.
- Introduce supplier quality controls for your top two variable ingredients. Require COAs (Certificates of Analysis) for moisture and fat content on every delivery. Cross-reference against FPY on the batches that used each lot.
- Apply poka-yoke at your highest-defect step. A physical stop that prevents a jar from advancing if its fill weight is out of tolerance is more reliable than an inspector catching it downstream.
180-day longer-term investments
- Integrate sensor data with production records. Real-time temperature, weight, and equipment cycle data connected to batch records enables automated variance detection that no manual system can match at scale.
- Build a supplier quality scorecard. Track incoming material variance by supplier and lot, and use it in purchasing decisions. Ingredient variance is often the largest single driver of FPY loss on food lines, and it is the one cause that production cannot fix internally.
Pro Tip: Sustaining FPY gains requires front-line ownership, not just management reporting. Post the daily FPY number at the line, visible to operators. When the number is theirs to own, behavior changes faster than any training program produces.
A real-world case: one food manufacturer improved first pass quality substantially and significantly cut raw-material waste, generating a strong return on investment on the improvement program. The gains came from management systems and structured measurement, not capital investment.
How does software help you measure and improve FPY?
Manual batch records and spreadsheets can get you to a baseline FPY number. They cannot detect the small recurring deviations that accumulate into large losses, and they cannot connect equipment behavior to quality outcomes in real time. That is where production intelligence software changes the picture.
Feature checklist for FPY-capable software:
- Batch-level yield reports by SKU, line, and shift
- Automated variance alerts when actual yield deviates from BOM yield
- Sensor integration for weight, temperature, and equipment cycles
- Operator note capture linked to batch and timestamp
- Rework tagging with reason codes (separate from scrap)
- RTY computation across multi-station lines
- AI-generated reports that surface recurring deviation patterns
AI-based production intelligence adds a layer that structured data collection alone cannot provide. Pattern detection across hundreds of batches identifies which combination of ingredient lot, equipment state, and operator shift correlates with FPY dips. Recurring deviation alerts flag a developing problem before it becomes a batch failure. Root-cause clustering groups similar defect events so engineers investigate one systemic cause rather than twenty individual incidents.
Report types your software should generate:
- Batch variance report: actual vs. BOM yield, scrap and rework breakdown, cost impact per batch
- Per-station FPY drilldown: FPY trend by station, shift, and SKU over a rolling period
- Rework capacity impact report: hours and units consumed by rework, expressed as equivalent lost production
Gembalabs is built specifically for small and medium-sized food manufacturers who need this level of visibility without the implementation complexity of enterprise ERP. It pulls raw data from equipment cycles, combines it with operator inputs on downtime and rework, and generates AI-driven production intelligence reports that answer the specific questions a manager needs answered. Bilingual support (English and Spanish) means the operators entering data and the managers reading reports are working in the same system without translation gaps. For a deeper look at how the production intelligence layer works, the Gembalabs intelligence page covers the feature set in detail.
How do you set FPY targets and build a monitoring process?
Setting a target before you have a baseline is guesswork. The sequence matters.
Target-setting steps:
- Measure actual FPY per line and per SKU for at least four weeks before setting any target. Seasonal variation, ingredient changes, and equipment age all affect what is achievable.
- Benchmark by product category. A high-care ready-meal line and a dry-goods packaging line have different FPY baselines. Applying a single facility-wide target obscures both problems and wins.
- Convert station FPY to RTY for multi-station lines. A 96% station FPY target on a six-station line implies an RTY of roughly 78%. If your capacity model requires 90% RTY, you need 98.3% per station, not 96%.
- Set tiered goals: a "floor" (below this triggers immediate investigation), a "target" (your 90-day goal), and a "world-class" reference (your 12-month aspiration).
Monitoring cadence and escalation:
- Per-shift: operators log FPY at batch close. Any batch below the floor threshold triggers a same-shift investigation note.
- Daily: production manager reviews per-line FPY trend and top loss drivers. A rolling three-shift FPY drop of more than two percentage points triggers a formal root-cause review.
- Weekly: QA and production review per-SKU FPY trends, rework hours, and cost impact. Supplier lot correlations reviewed here.
Dashboard defaults to show:
- Per-line FPY (current shift and rolling 7-day trend)
- Top three loss drivers by defect type and reason code
- Rework hours consumed (expressed as equivalent lost units)
- Variance from BOM yield % (actual vs. standard)
FPY targets only drive planning decisions when they are connected to capacity. If your line needs to produce 10,000 units per shift and your FPY is 88%, you need to start 11,364 units to finish 10,000 good ones. That 1,364-unit buffer has to come from somewhere: extra raw material, extra time, or extra labor. Making that math visible in the scheduling model is what turns FPY from a quality metric into an operational one.
Worked example: the cost impact of a 3-point FPY improvement
This example uses a sauce filling line producing 1,000 jars per shift, two shifts per day, 250 operating days per year.
Batch inputs and FPY calculation
| Input | Value |
|---|---|
| Units started per shift | 1,000 jars |
| Rework | 25 jars |
| Good units (no rework) | 940 jars |
| FPY | 94.0% |
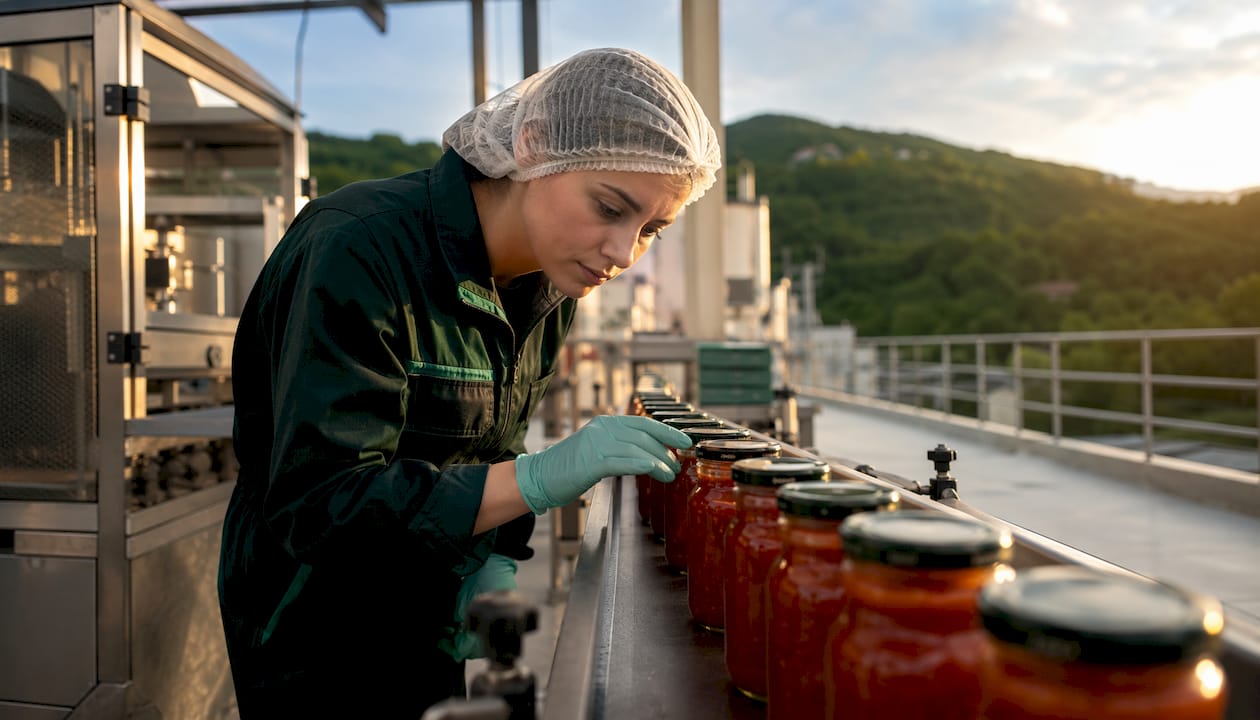
Cost impact of improving FPY from 94% to 97%
| Assumption | Value |
|---|---|
| Cost per jar (materials + direct labor) | $1.80 |
| Rework labor cost per jar | $0.45 |
| Shifts per day | 2 |
| Operating days per year | 250 |
| Current rework units per shift | 25 jars |
| Target rework units per shift (at 97% FPY) | 5 jars |
At 94% FPY, rework runs 25 jars per shift × 2 shifts × 250 days = 12,500 rework events per year. At $0.45 rework labor cost each, that is $5,625 in direct rework labor annually, plus the capacity those 12,500 events consumed.
Improving to 97% FPY reduces rework to 5 jars per shift, or 2,500 events per year. The direct labor saving is $4,500 per year. The freed capacity (10,000 jars per year) at $1.80 cost basis represents $18,000 in additional saleable output potential, assuming demand exists to absorb it.
Combined annual impact of a 3-point FPY improvement: approximately $22,500 on a single line. A facility with four lines running similar SKUs would see proportional gains. These figures are illustrative; your actual numbers depend on product cost, rework complexity, and line speed.
Key Takeaways
Improving first pass yield in food manufacturing requires batch-level measurement, front-line ownership, and production intelligence that connects equipment data to quality outcomes.
| Point | Details |
|---|---|
| FPY reveals the hidden factory | A plant at 90% FPY and 98% final yield is consuming roughly 8% of capacity on rework that final yield never shows. |
| Batch-level recording is non-negotiable | Per-SKU, per-batch reconciliation of inputs, scrap, and rework is required to move from assumed yield to verifiable control. |
| Small station gains compound fast | Improving each station from 95% to 99% FPY at every station raises five-station RTY from 77% to 95%. |
| A 3-point improvement pays quickly | On a single sauce line, raising FPY from 94% to 97% frees approximately $22,500 in annual labor and capacity value. |
| Gembalabs connects equipment and operator data | Gembalabs combines sensor cycles with operator rework notes and generates AI production intelligence reports for SME food facilities. |
The number your facility is probably not tracking
Most food plants track final yield. Some track scrap. Very few track rework as a separate capacity cost, and almost none connect rework events to the specific equipment state or ingredient lot that caused them. That is the gap FPY measurement closes, and it is a bigger gap than most managers expect when they first run the numbers.
The conventional wisdom is that rework is a quality problem. It is not. It is a scheduling problem, a capacity problem, and a cost problem that happens to show up in the quality data. A plant that treats rework as "acceptable" is essentially running a second, unpaid production shift inside the first one. The labor, the materials, the equipment time, and the scheduling disruption are all real costs. They just do not appear on any single report until someone builds the FPY measurement to surface them.
The other thing most guides understate: measurement consistency matters more than measurement sophistication. A simple batch record with a clear defect definition, filled out the same way on every shift, will generate more useful FPY data than a complex ERP module that operators fill out inconsistently. Start with the definition. Get the definition right before you invest in the system.
Gembalabs gives your facility batch-level FPY visibility from day one
Most SME food manufacturers know their final yield. Gembalabs shows you what is happening inside it: which batches are consuming rework capacity, which equipment events correlate with FPY dips, and which shifts are consistently outperforming the others.

The platform pulls data directly from equipment cycles and combines it with operator inputs on downtime, rework reason codes, and shift notes. Its AI layer generates production intelligence reports that answer specific questions: why did FPY drop on the Thursday night shift, which ingredient lot correlates with the seal failures, and how much capacity did last week's rework consume. Bilingual support in English and Spanish means every operator on your floor can contribute data in the language they work in.
The recommended starting point is one SKU on one line. That scope is small enough to prove your measurement definitions, validate your batch reconciliation process, and generate a baseline FPY number you can actually act on. Expected short-term outcomes: batch variance visibility within the first two weeks, a reduction in untracked rework events within 30 days, and a clear cost-impact picture within 60 days.
See how Gembalabs works and request a pilot for your facility.
Useful sources and further reading
These are the primary sources used in this article, along with a note on what each one covers.
- Turqosoft: Yield Tracking in Food Manufacturing — Practical framework for batch-level yield tracking, BOM yield standardization, and ROI mechanics for structured measurement programs.
- TeepTrak: FPY and RTY for Multi-Station Lines — Clear explanation of how per-station FPY compounds into RTY, with numeric examples showing the impact of small station-level improvements.
- UserSolutions: First Pass Yield Formula, Benchmarks, and Improvement Guide — Covers the hidden factory concept, rework capacity costs, and the distinction between FPY and final yield.
- Food For Analytics: Yield Optimization in Food Manufacturing — Explains how connecting input, output, waste, and cost data in one model makes yield optimization decisions possible.
- As One Consulting: Food Manufacturer Boosts First Pass Quality — Real-world case study: FPY improved from 75% to 88%, raw-material waste cut from over 30% to approximately 2.67%, with roughly a 4:1 ROI.
- OxMaint.ai: Food Plant First Article Inspection and Batch CMMS Guide — Covers FAI best practices and automated early-detection checks that prevent batch-level FPY failures from scaling.
- Gembalabs: Production Intelligence — Gembalabs's production intelligence platform for SME food manufacturers; starting point for a pilot or demo.