
Manufacturing data silos are isolated data sets trapped inside individual systems like ERP, MES, PLM, QMS, or shop-floor sensors, each holding a piece of the production picture that no other system can see. The result: your quality team is working from different numbers than your production team, root-cause investigations take hours instead of minutes, and any AI or analytics initiative you try to build collapses on incomplete data. The fastest way to start fixing this is a short discovery exercise, a people/process/technology inventory that locates where data lives, who owns it, and what's blocking access. From there, two moves deliver the most immediate value:
- Run a targeted pilot that connects sensor data to one production KPI (downtime, first-pass yield, or batch cycle time) so you can prove the value of connected data before committing to a large architecture project.
- Assign data ownership for that KPI so one person is accountable for freshness, quality, and access, which prevents the silo from re-forming the moment you turn your back.
The rest of this guide walks you through how silos form, how to find them, which architecture fits your situation, and a six-step plan to break them down without a rip-and-replace project.
Key Takeaways
Breaking down manufacturing data silos starts with a two-week discovery audit, a tightly scoped sensor-to-KPI pilot, and named data ownership before any integration architecture is chosen.
| Point | Details |
|---|---|
| Start with a discovery audit | Catalog every system, shadow spreadsheet, and data owner before choosing an architecture or integration tool. |
| Pilot sensor-to-KPI first | Connect one sensor stream to one business metric (downtime, first-pass yield) to prove value before scaling. |
| Assign named data owners | Ownership prevents silos from re-forming; one accountable person per dataset is the minimum governance requirement. |
| Match architecture to workload | ODS for near-real-time operations, lakehouse for AI readiness, virtualization for brownfield legacy preservation. |
| Gembalabs for food plant pilots | Gembalabs compiles sensor and operator data into AI-generated reports, making it a practical starting point for small and mid-sized food manufacturers running a first integration pilot. |
Table of Contents
- What do manufacturing data silos actually look like?
- How data silos harm operations, quality, and your analytics ambitions
- How to run a practical audit and find your silos
- What architecture fits your situation?
- Integration patterns and tools that actually work in manufacturing
- A six-step plan to break down silos in the next 90–180 days
- What sensor and operator data integration looks like in a food plant
- Common pitfalls and a governance checklist to keep improvements durable
- Why operational visibility should come before enterprise consolidation
- Gembalabs gives food manufacturers a faster path to operational visibility
- Sources
What do manufacturing data silos actually look like?
Walk into most mid-sized food or discrete manufacturing plants and you'll find the same pattern: the ERP holds inventory and order data, the MES tracks production orders and machine states, the PLM owns product specs and BOMs, and the QMS holds inspection results and non-conformance records. None of them talk to each other in real time. Operators fill in downtime logs on paper or in a spreadsheet because the MES doesn't capture the reason codes they actually use. The quality team exports a CSV from the QMS every morning and manually matches it to yesterday's batch records from the MES. That matching exercise is itself a silo, a shadow process built to compensate for a broken connection.
Data silos in manufacturing commonly arise from disconnected systems (ERP, MES, PLM, QMS), legacy platforms, and organizational structures that restrict cross-team data sharing. The root causes tend to cluster around a few patterns:
Legacy systems and bolt-on point solutions. A plant running a 15-year-old SCADA system wasn't designed to share data with a cloud analytics platform. When a new MES gets bolted on top, the integration is often a one-way CSV export scheduled nightly, not a live data feed.
Mergers, acquisitions, and decentralized purchasing. Two plants that merged three years ago may still run separate ERP instances with different item numbering conventions. Each site's IT team bought what solved their immediate problem, with no thought for how the data would eventually connect.
Organizational structure and governance gaps. When the production team, quality team, and engineering team each own their own systems and report to different VPs, nobody has the authority or incentive to standardize data definitions across functions. "Downtime" means something different in the MES than it does in the maintenance system, and both differ from what the plant manager reports to finance.
The most visible symptom is multiple "versions of truth." Ask three people what last week's OEE was and you'll get three different numbers, each correct within its own system and wrong relative to the others.
How data silos harm operations, quality, and your analytics ambitions
The operational cost of fragmented data shows up in ways that are easy to underestimate until you add them up. When a production batch gets stuck because the MES shows it as complete but the QMS hasn't released it yet, someone has to make a phone call, pull a report, and manually reconcile the two systems. That's some time of a supervisor's time, per incident, every time it happens. Multiply that across shifts and facilities and the reconciliation burden becomes a significant labor cost with no production value attached to it.
Quality investigations suffer most. Linking a batch genealogy record to the sensor events that occurred during that batch, and then to the operator notes from that shift, requires pulling data from three or four systems that were never designed to share a common batch ID. Root cause analysis that should take 30 minutes stretches to half a day because the data preparation work is manual every time.
The analytics and AI problem is subtler but more damaging long-term. Even after centralizing storage, AI and advanced analytics still require inventories, repeatable access paths, and governance so models can reliably find and prepare data over time. Data silos block AI projects not just at the storage level but at the feature-preparation level: if the path from raw sensor data to a clean training dataset changes every time someone runs it, your model's performance will be inconsistent and your team will spend more time on data wrangling than on model improvement.
Inventory mismatches, delayed production releases, and manual reconciliation work are the visible costs. The invisible cost is the analytics capability you're not building because your data foundation isn't reliable enough to build on.
How to run a practical audit and find your silos
A discovery audit doesn't need to be a six-month consulting engagement. A focused two-week effort, done right, will surface the highest-priority silos and give you enough information to prioritize remediation. The recommended first step is an organization-wide discovery of people, processes, and technology to locate fragmented data and clarify ownership before choosing integration approaches.
Discovery steps
Start by inventorying every system that touches production data: ERP, MES, PLM, QMS, CMMS, lab systems, and any SaaS tools individual departments bought on their own. That last category, shadow IT, is where the most damaging silos hide. A quality manager running a critical traceability process in a shared Excel file on a network drive is a silo with no owner, no backup, and no audit trail.
Map the data consumers next. Who uses what data, for what decision, and how often? This reveals which connections are most operationally critical and which silos are causing the most daily friction.
Assign a data owner to each dataset before you leave the discovery phase. Without ownership, nothing you build will stay clean.
Audit checklist
Use this checklist for each dataset you find:
| Field | What to capture |
|---|---|
| Dataset name | What the team calls it |
| Source system | Which application generates it |
| Format | Database table, API, CSV, spreadsheet |
| Owner | Named individual, not a team |
| Refresh cadence | Real-time, hourly, daily, manual |
| Access restrictions | Who can read/write and why |
| Known quality issues | Missing fields, duplicates, stale records |
Sample metrics to prioritize remediation
Once you've cataloged your datasets, score them on four dimensions to decide where to start:
| Metric | What it measures | Target |
|---|---|---|
| Data freshness lag | Time between event and availability | Under 15 minutes for operational data |
| Duplication rate | Percent of records duplicated across systems | Below 5% |
| Version conflicts | Frequency of mismatched values for the same entity | Zero for master data |
| Time-to-reconcile | Hours spent manually aligning datasets per week | Trending toward zero |
Pro Tip: Run at least one cross-functional workshop with front-line operators before you finalize the audit. Operators know about undocumented data processes and shadow spreadsheets that will never appear in a system inventory. A 90-minute session with two or three operators from different shifts will surface more hidden silos than a week of IT interviews.
What architecture fits your situation?
The architecture question trips up a lot of manufacturing teams because they approach it as a binary: either centralize everything into one system or leave things as they are. The real answer is more nuanced, and it starts with understanding that operational and analytical data planes are optimized for different workloads. Operational data is low-latency and granular, built for transactions. Analytical data is derived and aggregated, built for reporting and modeling. Treating them as the same problem leads to architectures that are either too slow for operations or too rigid for analytics.
Common architecture patterns and when to use each
EDW, ODS, data marts, and lakehouse architectures serve different use cases; choose based on scope, latency, and the analytic workloads you need to support. Here's how they map to manufacturing contexts:
| Architecture | Best for | Latency | Cost to implement | Governance control |
|---|---|---|---|---|
| Enterprise Data Warehouse (EDW) | Enterprise reporting, compliance, finance | Hours to daily | High | High |
| Operational Data Store (ODS) | Near-real-time operations, shift reporting | Minutes | Medium | Medium |
| Data Mart | Department-specific analytics (quality, supply chain) | Hours | Low to medium | Medium |
| Data Lakehouse | AI/ML workloads, flexible schema, long-term analytics | Minutes to hours | Medium to high | Medium (requires effort) |
| Data Virtualization | Access legacy systems in place, no migration | Near-real-time | Low upfront | Low to medium |
When to choose virtualization or orchestration: If your priority is preserving legacy systems while adding connectivity, and you don't need to move data, virtualization lets you query across systems without a migration project. It's the right call for a brownfield plant that can't afford downtime for a data migration.
When to choose a cloud lakehouse: If AI readiness is a 12-month goal and you're generating significant sensor data, a lakehouse gives you the schema flexibility to ingest raw OT data and refine it over time. It handles the unstructured and semi-structured data that a traditional EDW struggles with.
When an ODS is the right bridge: For near-real-time shift reporting and operational dashboards, an ODS sits between your transactional systems and your analytical layer. It's the right choice when you need fresher data than a nightly EDW load provides but don't yet need the full complexity of a lakehouse.
For brownfield factories specifically, edge-cloud dualism is often the practical answer: time-critical preprocessing runs on the edge near PLCs and SCADA, while the cloud handles model training and cross-site analytics. This avoids the latency problem of sending every sensor event to the cloud while still enabling centralized analytics.
Integration patterns and tools that actually work in manufacturing
The architecture defines where data lives. The integration pattern defines how it moves. These are the patterns that show up most often in successful manufacturing data projects:
ELT to a central warehouse or lakehouse works well when you have structured source systems (ERP, MES) and a clear analytical destination. Extract the raw data, load it, then transform it in the destination where you have compute power. Tools like dbt handle the transformation layer cleanly.
Change Data Capture (CDC) is the right pattern when you need low-latency updates from transactional systems without polling them constantly. CDC watches the database transaction log and publishes only the changed records, which reduces load on source systems and keeps your analytical layer fresher.
Unified Namespace (UNS) with a broker pattern is increasingly the standard for OT/IT integration. A UNS centralizes event publication from shop-floor devices so MES, ERP, QMS, and analytics can all subscribe to the same structured events, eliminating the fragile point-to-point integrations that create new silos every time you add a system. MQTT is the typical transport protocol; Sparkplug B provides the payload structure.
OPC UA is the OT-side standard for connecting PLCs, SCADA, and edge devices to higher-level systems. An OPC UA server on the edge translates proprietary PLC protocols into a standard format that your integration layer can consume. Pair it with an edge gateway and you have a clean path from machine data to your analytics layer.
Reverse ETL closes the loop by pushing clean, transformed data back into operational tools. Your ERP or MES doesn't need to become your analytics platform; reverse ETL lets operators see analytics-derived insights (predicted downtime, yield forecasts) inside the tools they already use.
For predictive maintenance specifically, a layered pipeline works well: unified acquisition via OPC UA or MQTT, automated validation and standardization, an AI deployment layer, and bi-directional workflow integration so maintenance actions update operational records. The bi-directional piece is what most teams skip, and it's why maintenance insights don't make it back into the MES.
A six-step plan to break down silos in the next 90–180 days
This is a prioritized execution sequence, not a wish list. Each step builds on the previous one.
-
Run the discovery audit. Use the checklist from the audit section. Catalog every system, every shadow spreadsheet, every data owner. Time-box it to two weeks. The goal is a prioritized list of silos, not a perfect inventory.
-
Pick a minimum viable pilot. Choose one connection that links sensor data to a single business metric: unplanned downtime to machine sensor events, or first-pass yield to batch sensor data. First-pass yield tracking is a strong pilot candidate because the business value is immediately visible and the data sources are usually well-defined.
-
Define data ownership and quality gates. Before writing a single line of integration code, assign a named owner to each dataset in the pilot. Define what "good data" looks like: acceptable freshness lag, required fields, and the process for handling schema changes.
-
Choose your integration pattern. For most small and mid-sized food manufacturers, an ODS with CDC or a UNS/MQTT pattern for OT data is the right starting point. It's lower cost than a full lakehouse, faster to implement than an EDW, and gives you near-real-time operational data without a major infrastructure investment.
-
Run the pilot and measure KPIs. Track data freshness lag, time-to-root-cause, reconciliation hours saved per week, and the percentage of KPIs that are now automated versus manually calculated. These four metrics tell you whether the integration is actually working or just technically connected.
-
Scale with MDM and governance. Once the pilot proves value, combine data governance, master data management (MDM), and a cloud data lakehouse or API-first approach with cultural change management to expand without creating new silos. MDM ensures that "product" means the same thing in every system. Governance ensures that the data quality you achieved in the pilot doesn't erode as you add more sources.
Roles that need to be in the room: a plant operations sponsor who can make decisions, a named data owner per dataset, a data engineer or integration specialist, a QA lead who understands batch genealogy requirements, and your vendor or IT contact for each source system. Without the plant ops sponsor, integration projects stall when they hit organizational resistance.
What sensor and operator data integration looks like in a food plant
Consider a mid-sized food manufacturer running two production lines. Production data lives in the MES. Quality inspection results live in the QMS. Operators track downtime reasons in a shared Google Sheet because the MES reason codes don't match how the floor actually works. When a batch fails final inspection, the quality team spends two to three hours pulling records from three systems and interviewing operators to reconstruct what happened during that batch.

The intervention: publish shop-floor sensor streams (temperature, line speed, fill weight) to a unified namespace using MQTT and Sparkplug B. Capture operator notes, including downtime reasons and shift observations, into the same event stream via a tablet interface on the line. Map every event to a batch ID so the entire production history of a batch is queryable in one place. Integrate shift handover notes into the same stream so the incoming shift has context without a separate handoff meeting.
The before/after results from this type of integration are consistent across similar projects: time-to-root-cause drops significantly because the data preparation work is eliminated. Unplanned downtime decreases as recurring equipment issues become visible in the data before they cause failures. First-pass yield tracking, which was previously a manual calculation, becomes more frequently and reliably automated.
The operator note integration is the piece most teams underestimate. Sensor data tells you what happened. Operator notes tell you why. Connecting both to the same batch ID is what makes root-cause analysis genuinely fast. Gembalabs is built around exactly this pattern: sensor data and operator inputs compiled together, with AI-generated reports that surface what actually matters from that combined stream.

Common pitfalls and a governance checklist to keep improvements durable
Most manufacturing data integration projects don't fail on the technology. They fail on the governance and the organizational dynamics around it.
Unclear ownership is the most common failure mode. If nobody is accountable for a dataset's quality, it degrades. Schema changes happen without notice. Fields go missing. The integration breaks and nobody knows whose job it is to fix it.
One-off point integrations create new silos. Every time a team builds a direct connection between two systems without going through a shared integration layer, they add another brittle pipe that breaks when either system changes. After three years of this, you have a spaghetti architecture that's harder to maintain than the original silos.
Over-centralization before buy-in kills projects. A plant manager who gets told their local reporting will be replaced by a centralized dashboard they don't control will find ways to keep the local spreadsheet alive. Pilot-first approaches work because they demonstrate value before asking anyone to give something up.
Ignoring operator workflows is a close second. If the integration doesn't capture the data operators actually generate, and doesn't give them something useful back, they'll route around it. Standard work documentation that incorporates data entry into the operator's natural workflow is more durable than a separate data entry step.
Governance checklist
Use this to assess whether your integration will hold up over time:
- Named data owner for every dataset, with documented responsibilities
- SLA for data freshness (what's the maximum acceptable lag for each dataset?)
- Schema-change process (who approves changes, how are downstream consumers notified?)
- Semantic layer or metric definitions (what does "downtime" mean, exactly, and who decides?)
- Role-based access control (RBAC) with audit logging so you know who accessed what
- Regular data quality reviews, at least monthly for operational datasets
Red flags to watch for during a project: if manual reconciliation work persists three months after go-live, the integration isn't actually solving the problem. Recurring schema drift incidents mean the change management process isn't working. And if you can't point to measurable KPI improvements after the pilot, the pilot wasn't scoped tightly enough.
Why operational visibility should come before enterprise consolidation
The conventional wisdom in data architecture circles is to build the foundation first: governance framework, MDM, enterprise data model, then connect the systems. The logic is sound on paper. In practice, it produces projects that take 18 months to show any value, exhaust their political capital before the first dashboard goes live, and get cancelled or scaled back before they reach the shop floor.
The more durable approach starts with operational visibility. Connect sensor data to one production KPI. Get operators and supervisors looking at the same numbers in real time. That single connected data stream, even if it's imperfect, builds more organizational trust in data integration than any governance framework document ever will.
The governance and the lakehouse architecture matter. They're the foundation for long-term analytics and AI. But they work better as a second phase, after you've proven that connected data produces better decisions on the floor. A small pilot that reduces time-to-root-cause from three hours to 25 minutes is the most persuasive argument for a larger investment you'll ever make.
The other thing most teams underestimate is the people investment. Technology choices matter less than whether operators trust the system enough to use it and whether plant managers trust the data enough to act on it. A lightweight platform that operators actually engage with beats a sophisticated architecture that sits unused. Preserve legacy systems where you can; add connectivity rather than replacement. The goal is a connected operation, not a perfect data model.
Gembalabs gives food manufacturers a faster path to operational visibility
Small and mid-sized food manufacturers don't need a six-figure data architecture project to get connected data on the shop floor. Gembalabs takes a sensor-first approach: it captures equipment cycle data and operator inputs (downtime reasons, rework notes, shift observations) and compiles them into AI-generated production intelligence reports that tell you what's actually happening in your facility, in plain language, without requiring a data engineer to interpret the output.
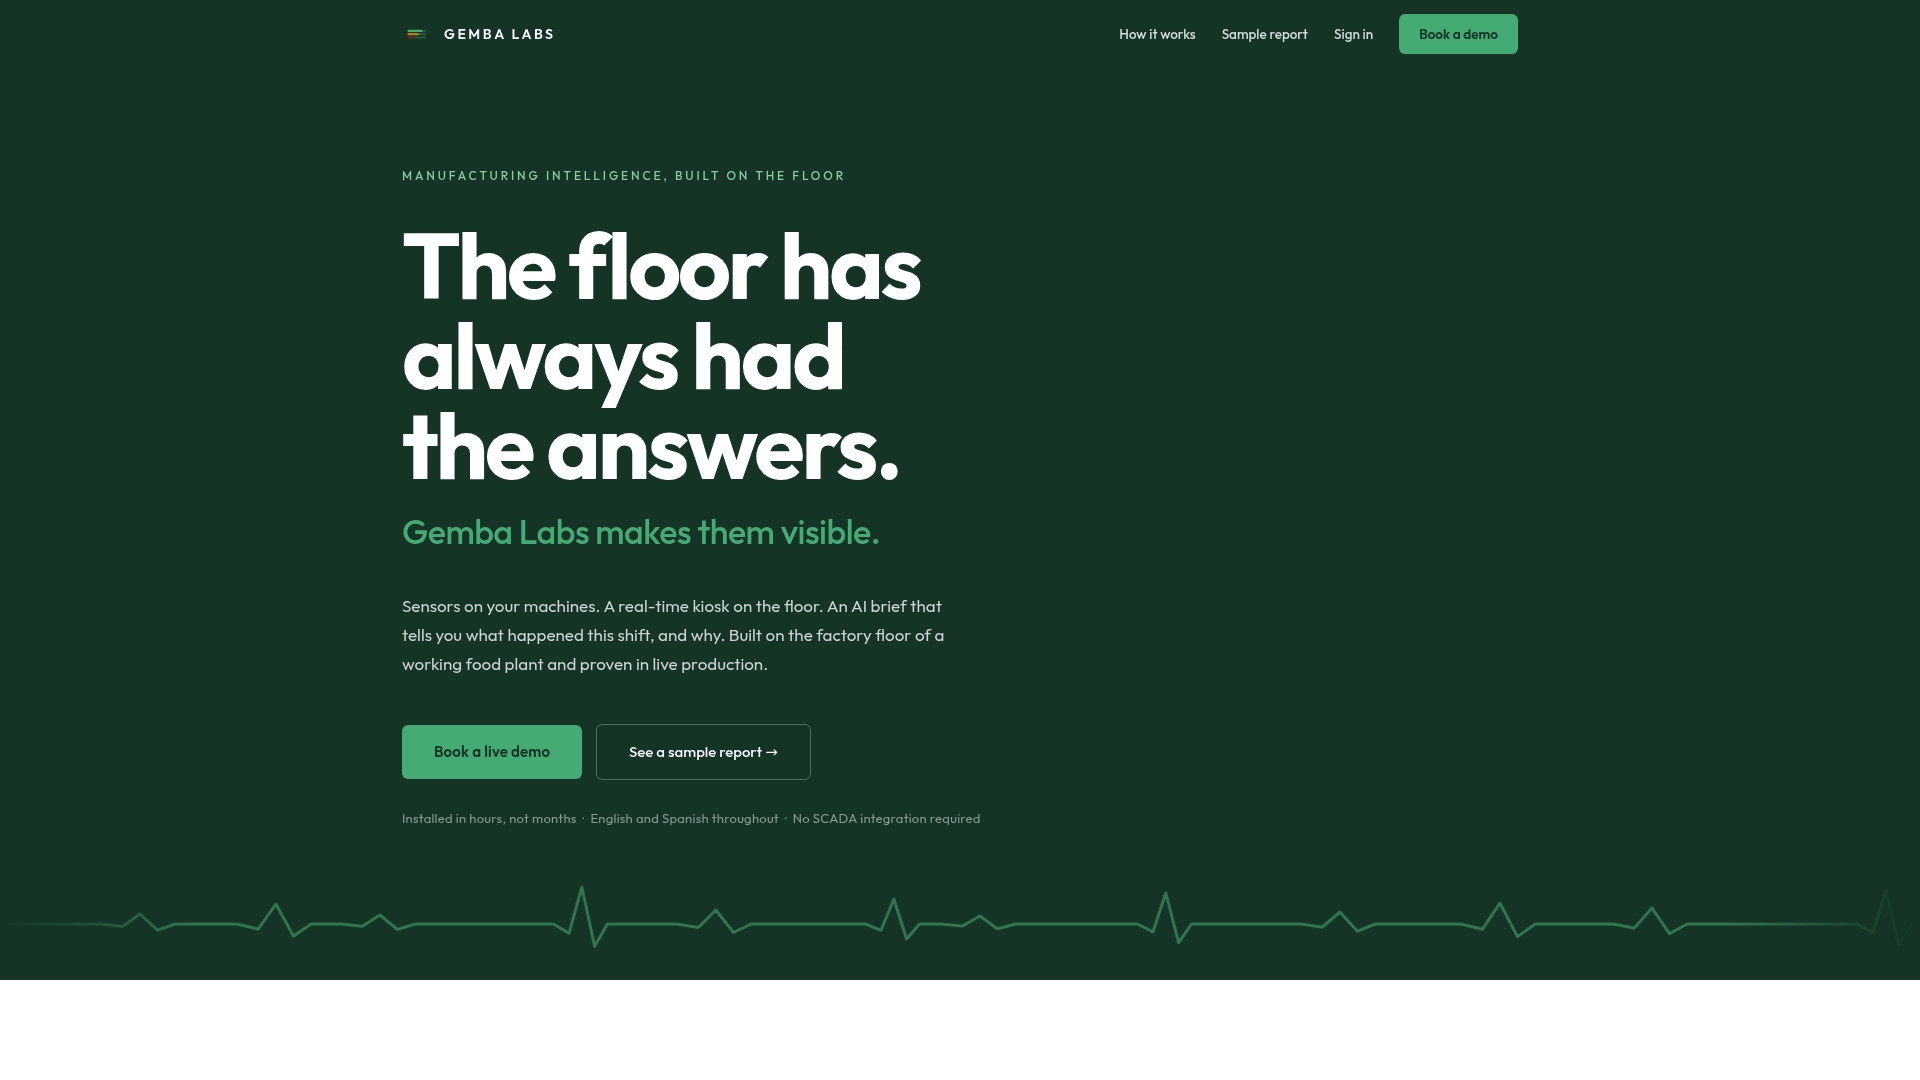
The practical use cases align directly with the pilot approach this guide recommends: downtime root-cause analysis, first-pass yield tracking, and automated shift reporting. Operator notes and sensor events are mapped to the same production context, which is the connection that makes root-cause work fast. Reports are available in both English and Spanish, which matters in food manufacturing environments where bilingual communication is a daily operational reality.
If you're at the pilot stage and want to see what connected sensor and operator data looks like in practice, see how Gembalabs works or book a demo to walk through a setup specific to your facility.
Sources
These resources are worth bookmarking as you build your discovery audit and architecture decision matrix: