
For small and mid-sized food manufacturers, the best AI reporting tools combine sensor data from your equipment with structured operator inputs to generate production-intelligence reports on downtime, rework, shift performance, and recurring issues. Gembalabs is built specifically for this: it connects to your existing equipment, captures operator context in English and Spanish, and surfaces the "why" behind production problems, not just the numbers.
Two reasons this approach pays off fast:
- Primary ROI driver: Unplanned downtime is one of the highest-cost events in food and beverage plants. Sensor-plus-operator reporting cuts the time from event to root cause, which directly reduces repeat stoppages.
- Practical fit: A focused 2–4 week pilot on one line gives you measurable results before any broad commitment. Bilingual operator workflows mean your floor team can actually use it from day one.
HACCP and SQF audits require traceable, timestamped production records. A platform that generates those automatically is not a nice bonus; it is an operational requirement.
Table of Contents
- What criteria should you use to choose AI reporting tools?
- What reports and KPIs should you expect from a floor-level system?
- How long does a pilot take, and what ROI should you expect?
- What are the technical integration requirements for production reporting?
- How do you onboard operators and manage the change?
- What vendor red flags should you watch for?
- What does a real pilot look like in a small food facility?
- Key Takeaways
- Why dashboards are the wrong place to start
- Gembalabs gives you the pilot-first path to production intelligence
- Useful references and where to learn more
What criteria should you use to choose AI reporting tools?
Integrating new technology into legacy food plant systems is the single most common failure point in manufacturing digitalization. Use this checklist to rule vendors in or out before you spend time on demos.
- Integration and protocols: Does the platform connect to your PLCs, SCADA, or edge sensors via OPC-UA, MQTT, or Modbus? Ask: "Which protocols do you support out of the box, and what does brownfield integration look like for a plant with mixed-age equipment?"
- Sensor agnosticism: Can you use your existing sensors, or does the vendor require proprietary hardware? Proprietary hardware creates lock-in and drives up long-term costs.
- Operator input capture: Does the platform support digital checklists, shift notes, and downtime reason codes? Ask whether bilingual (English/Spanish) interfaces are standard or a paid add-on.
- Contextualization methodology: Raw sensor signals alone do not explain why a line stopped. The platform must map sensor readings to process variables and link them to operator-provided context to surface root causes, not just symptoms.
- Audit-ready reporting and traceability: Can the system export timestamped, traceable records for HACCP, SQF, or FSMA audits without manual reformatting?
- Deployment complexity and pilot terms: Will the vendor run a time-boxed pilot with defined success metrics? Avoid open-ended pilots with no exit criteria.
- Data ownership and security: Who owns your production data? Confirm in writing that you retain full ownership and that data is not used to train third-party models.
- Support and training: Does the vendor offer on-site onboarding and bilingual training materials? Remote-only support is a real risk for floor-level adoption.
- Pricing model and scale path: Is pricing per line, per sensor, or per user? Understand what the cost looks like when you add a second facility or a third shift.
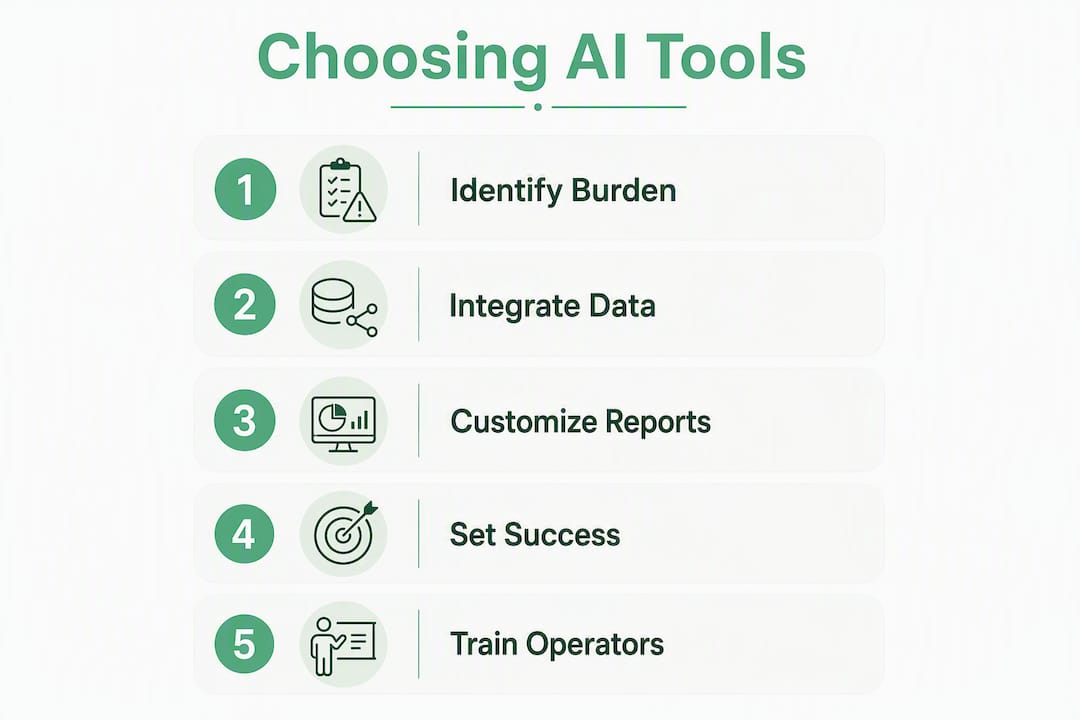
Pro Tip: During your pilot, start with the processes that carry the highest manual burden: paper downtime logs, handwritten quality checklists, and shift handover notes. Digitizing these first gives you the fastest, most visible ROI and builds operator buy-in before you expand.
What reports and KPIs should you expect from a floor-level system?
A production-intelligence platform should deliver reports your shift lead can read in five minutes and your quality manager can hand to an auditor without editing. The daily production report is the baseline; everything else builds from it.
Essential report types:
- Audit-ready maintenance history: — Timestamped corrective actions linked to equipment IDs
| KPI | Why it matters | Minimum data inputs required |
|---|---|---|
| Downtime rate (%) | Quantifies lost capacity per shift | Equipment event tag + operator reason code + timestamp |
| First-pass yield (%) | Measures rework burden and material cost | Operator rework count + production quantity |
| Cycle speed vs. target | Detects drift before a stoppage occurs | Sensor cycle tag + target rate from recipe |
| Line availability (OEE-A) | Tracks scheduled vs. actual run time | Event log + shift schedule |
| Recurring issue frequency | Identifies repeat failures for root-cause work | Downtime log + root-cause tags across shifts |
Report customizability matters too. Filters by line, SKU, shift, and date range are the minimum. Bilingual export (English and Spanish PDF or CSV) is worth asking for explicitly, especially if your supervisors and operators work in different languages.
How long does a pilot take, and what ROI should you expect?
A realistic timeline for a brownfield food plant looks like this:
- Week 1 (scoping): Sensor audit, PLC/SCADA mapping, operator workflow review, pilot line selection
- Weeks 2–6 (pilot): Sensors connected, operator inputs live, first AI reports generated and reviewed with the floor team
- Weeks 4–12 (phased rollout): Additional lines added, report templates finalized, audit-ready exports configured
Primary cost drivers are sensor count and type, edge gateway hardware for older PLCs, operator training time, and any custom report templates for compliance. Many manufacturers allocate a significant share of their equipment and systems budgets to digital and automation projects, so this is not a fringe investment.
A simple ROI calculation: take the hours of unplanned downtime per month on your pilot line, multiply by your fully loaded cost per hour (labor + lost throughput), then estimate a conservative 20% reduction. Add rework material savings and supervisor time saved on manual reporting. For a line running 160 production hours per month at $400/hour fully loaded, a 20% downtime reduction is $12,800/month in recovered value before any rework savings.
Pro Tip: Before the pilot starts, write down two specific success criteria: for example, "reduce unplanned downtime on Line 3 by 15% over four weeks" and "cut shift-report completion time from 30 minutes to 10 minutes." Vague pilots produce vague results and stall rollout decisions.
What are the technical integration requirements for production reporting?
Survey data shows 72% of food and beverage operations report poor data connectivity across systems, 74% cite out-of-date information as an operational problem, and 76% cite impacts from inaccurate data. The integration layer is where most pilots succeed or fail.
Required protocols and connections: OPC-UA for modern PLCs, Modbus for older equipment, MQTT for edge devices, and historian/SCADA connectors for plants already running Ignition or similar systems. For food lines, minimum sampling rates are typically 1-second cycles for event detection and 10-second averages for temperature and RPM.
The "unifying methodology" concept from IFT sensor research is straightforward in practice: raw signals (a motor current spike, a temperature deviation) only become useful when mapped to a process variable (mixer overload, oven drift) and linked to an operator note (product changeover, ingredient batch change). Without that mapping, your AI reports surface symptoms. With it, they surface causes.
| KPI | Required sensor tags | Required operator inputs |
|---|---|---|
| Downtime root cause | Equipment event tag, timestamp | Operator reason code, corrective action note |
| Rework rate | Production count sensor | Operator rework quantity + reason |
| Cycle speed drift | Cycle pulse or encoder tag | Target rate from recipe/shift plan |
| Temperature exceedance | Thermocouple or RTD tag | Operator acknowledgment + corrective action |
For more on IoT sensor selection for food plants, including washdown-zone considerations, the Gembalabs blog covers practical hardware choices.
Pro Tip: Choose sensor-agnostic software and specify IP65 or IP67-rated sensors for any washdown zone. Proprietary sensor ecosystems lock you into one vendor's hardware pricing and limit your options when a sensor fails.
How do you onboard operators and manage the change?
Academic research on food quality digitalization consistently identifies leadership buy-in and employee training as the primary barriers, not the technology itself. The rollout plan matters as much as the software.
A practical onboarding sequence:
- Identify the two or three paper forms with the highest daily burden (downtime log, quality checklist, shift handover).
- Digitize one form first. Run it on one shift for two weeks before adding more.
- Identify an operator champion on the pilot line: someone engaged, respected by peers, and dealing with a measurable recurring problem.
- Provide short bilingual quick-start guides (one page, English and Spanish) and run one shadow shift where a trainer works alongside the operator.
- Set a refresher check-in at week three to catch friction before it becomes resistance.
Standard work documentation embedded directly in the operator UI, as on-screen prompts during shift handover, reduces the cognitive load of adopting a new system. Mobile-first interfaces matter here: operators at a line do not have time to navigate a desktop dashboard.
Pro Tip: Pick your pilot line based on two factors: an engaged lead operator and a documented recurring downtime problem. That combination gives you a motivated champion and a measurable outcome to point to when you present results to leadership.
What vendor red flags should you watch for?
Some of these are common enough that they deserve a direct list.
- "No integration required": Every real production-intelligence platform requires some integration work. A vendor who says otherwise is either selling a disconnected dashboard or hiding the complexity in implementation fees.
- Closed hardware ecosystems: If the vendor requires you to buy their sensors, ask what happens to your data and your system if you switch vendors in three years.
- Vague data ownership terms: "Your data is secure" is not a data ownership clause. Get it in writing: you own your production data, full stop.
- No defined pilot success metrics: A pilot without agreed KPIs is a sales engagement, not a proof of value.
- English-only operator interfaces: If your floor team works primarily in Spanish, an English-only UI will kill adoption regardless of how good the AI reports are.
Implementation pitfalls follow a predictable pattern: teams start with high-level dashboards instead of floor-level event capture, skip operator workflow mapping, and end up with reports that look good in a demo but do not reflect what actually happens on the line. Poor sampling resolution (polling every 60 seconds on a line with 10-second cycle times) is a technical version of the same problem.
On contract terms: insist on a time-boxed pilot (4–6 weeks maximum) with written success gates and a clear rollback plan if the pilot does not hit them.
What does a real pilot look like in a small food facility?
Consider a small bakery running two production lines with persistent repeat downtime on their mixing line. The problem: the same mixer motor was stopping two to three times per shift, and the paper log showed "mechanical issue" every time with no further detail.
Pilot setup: One edge gateway connected to the mixer PLC, capturing motor current and cycle events at 1-second resolution. Operators given a digital downtime form with five reason codes (mechanical, material, operator, changeover, other) plus a free-text note field, in English and Spanish.
What the data showed: Motor current spiked consistently 8–12 minutes after a product changeover involving a high-viscosity dough. The operator notes confirmed the mixer was being loaded above its rated capacity for that recipe. The root-cause analysis pointed to a recipe parameter, not a mechanical fault.
Corrective action: Recipe adjusted to split the high-viscosity batch into two smaller loads. Motor current normalized within two days.
Pilot outcome: Repeat mixer stoppages dropped significantly within three weeks. Operators reported the digital form took less time to complete than the paper log. The shift summary report, generated automatically each morning, replaced a lengthy manual compilation process.
This is the pattern a good pilot follows: a narrow problem, sensor data plus operator context, a root cause that was invisible without both inputs, and a corrective action that sticks.
Key Takeaways
Sensor-plus-operator integration is the deciding factor in whether AI production reports surface root causes or just repackage the symptoms your team already knows.
| Point | Details |
|---|---|
| Integration comes first | Prioritize OPC-UA, MQTT, and Modbus connectivity before evaluating report features. |
| Operator context is required | Sensor signals alone surface symptoms; operator reason codes and shift notes reveal causes. |
| Pilot narrow and fast | Scope a 2–4 week pilot on one line with two written success criteria before committing to rollout. |
| Bilingual support is non-negotiable | English-only interfaces will stall adoption on mixed-language floors; confirm Spanish support upfront. |
| Gembalabs fits this model | Gembalabs combines sensor data, bilingual operator inputs, and AI-generated reports in a pilot-first SaaS model for small and mid-sized food plants. |
Why dashboards are the wrong place to start
The conventional pitch for manufacturing software is always the dashboard: a clean screen showing OEE, downtime, and yield in real time. It looks compelling in a demo. The problem is that a dashboard is the output of a working data pipeline, not the pipeline itself. Most small food plants that buy dashboard-first software end up with a screen that shows them the same numbers their operators already know, just displayed more attractively.
The real leverage is upstream: closing the gap between what your equipment is actually doing and what your planning and quality systems think it is doing. That gap, documented across food and beverage operations, is where unplanned downtime hides and where rework accumulates without a traceable cause. Operator context is the other half. A current spike means nothing without the operator note that says "high-viscosity batch, overloaded." Together, they give you a root cause you can act on.
Start with the integration. Start with the operator workflow. The reports that matter will follow.
Gembalabs gives you the pilot-first path to production intelligence
Most food plants already have the data. The problem is that it lives in three places at once: a PLC log no one reads, a paper downtime sheet, and a supervisor's memory. Gembalabs pulls those three sources together, adds AI-generated reporting on downtime, rework, shift performance, and recurring issues, and delivers it in a format your operations team can actually use, in English and Spanish.
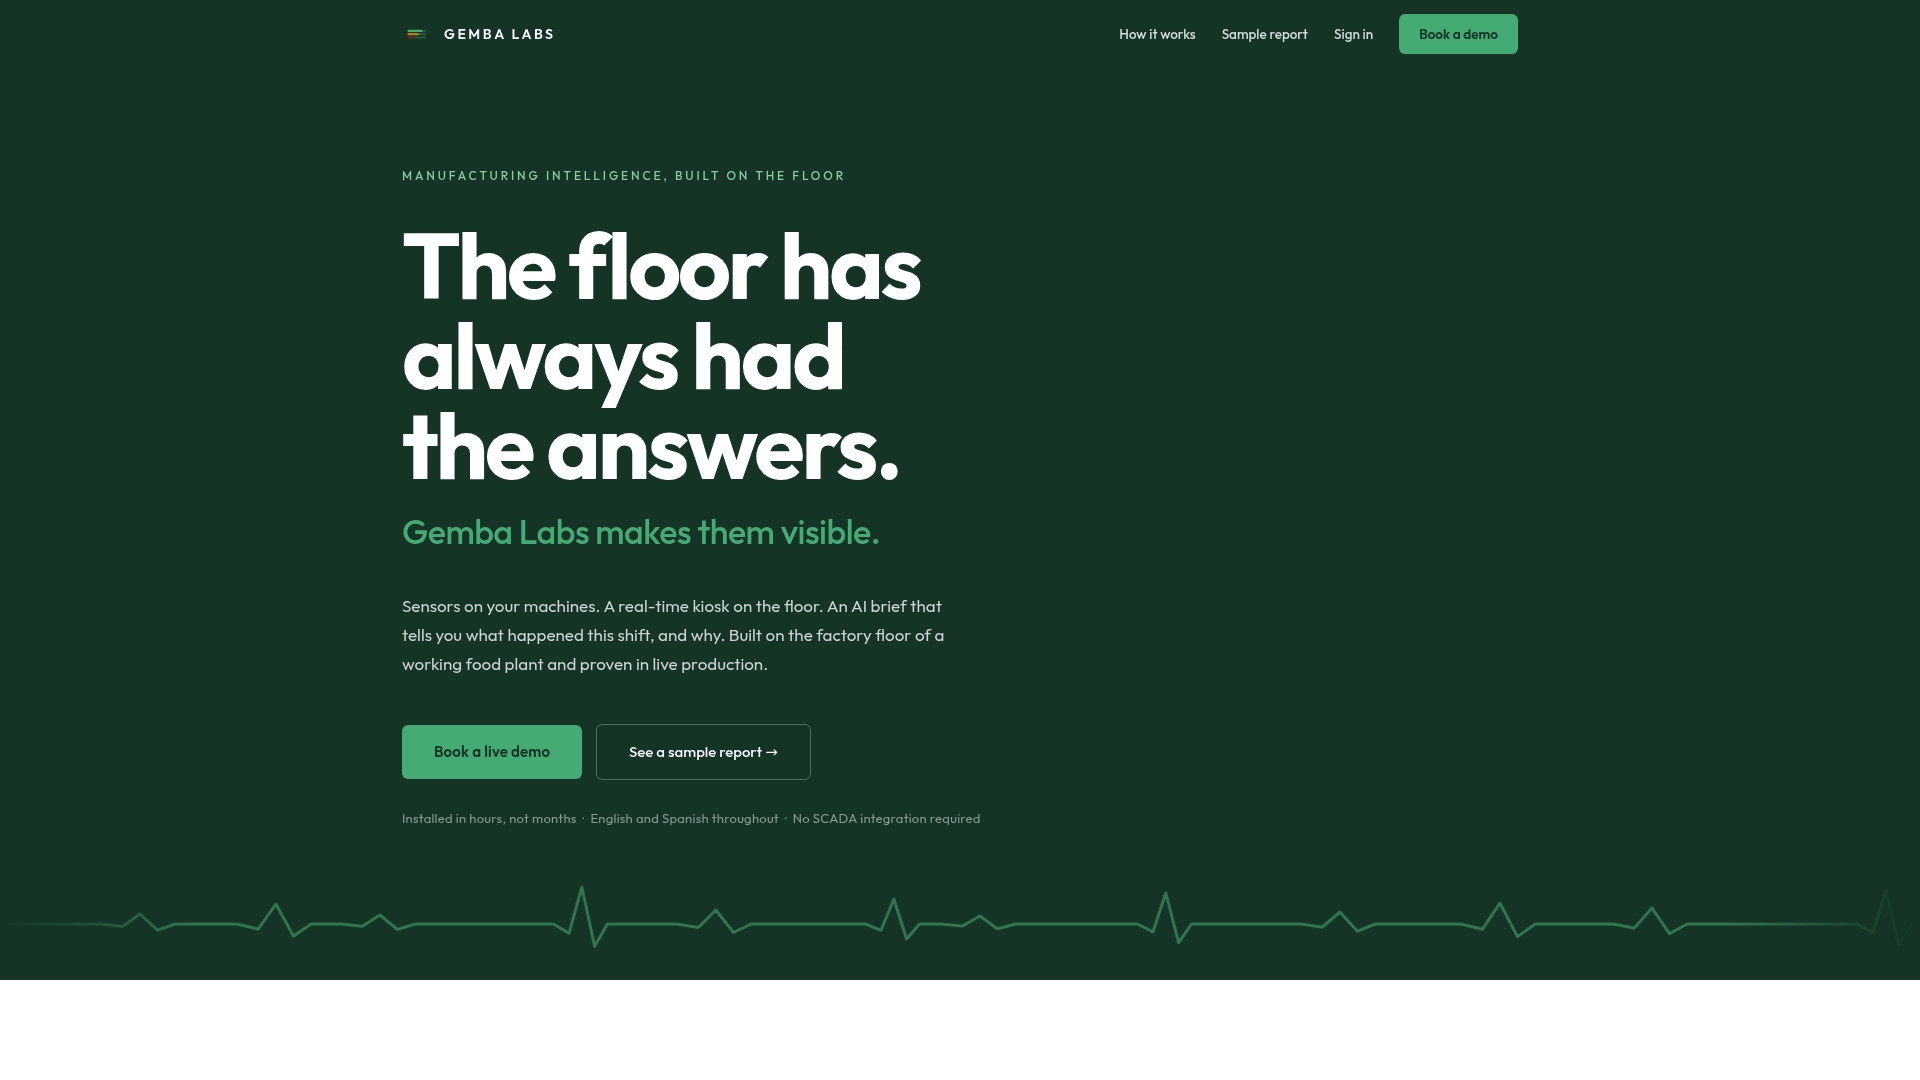
The pilot model is direct: one line, 2–4 weeks, defined success criteria. Gembalabs connects to your existing equipment via standard protocols, so there is no rip-and-replace. Operator onboarding uses bilingual quick-start materials, and the AI reports are configured around the specific KPIs your facility tracks, not a generic template. Audit-ready exports for HACCP and SQF are built in, not bolted on.
To scope a pilot for your facility, visit Gembalabs production intelligence and request a walkthrough. Bring your top two downtime problems and your current shift-reporting process. That is all you need to start.
Useful references and where to learn more
- The 4-Stage Integration Gap Holding Food Manufacturers Back in 2026 — Food Industry Executive
- Exploring the technological and managerial barriers to the digitalisation of food quality control systems — Procedia Computer Science, 2025
- IFT expert analysis on aligning sensor data with process variables — IFT / Comprehensive Reviews in Food Science and Food Safety
- IoT in Food Manufacturing: A Guide for SME Operators — Gembalabs Blog
- Daily Production Report Guide for Food Manufacturers — Gembalabs Blog
- Root Cause Analysis in Manufacturing: A Practical Guide — Gembalabs Blog
- Traceability in Food Manufacturing: A Practical Guide — Gembalabs Blog