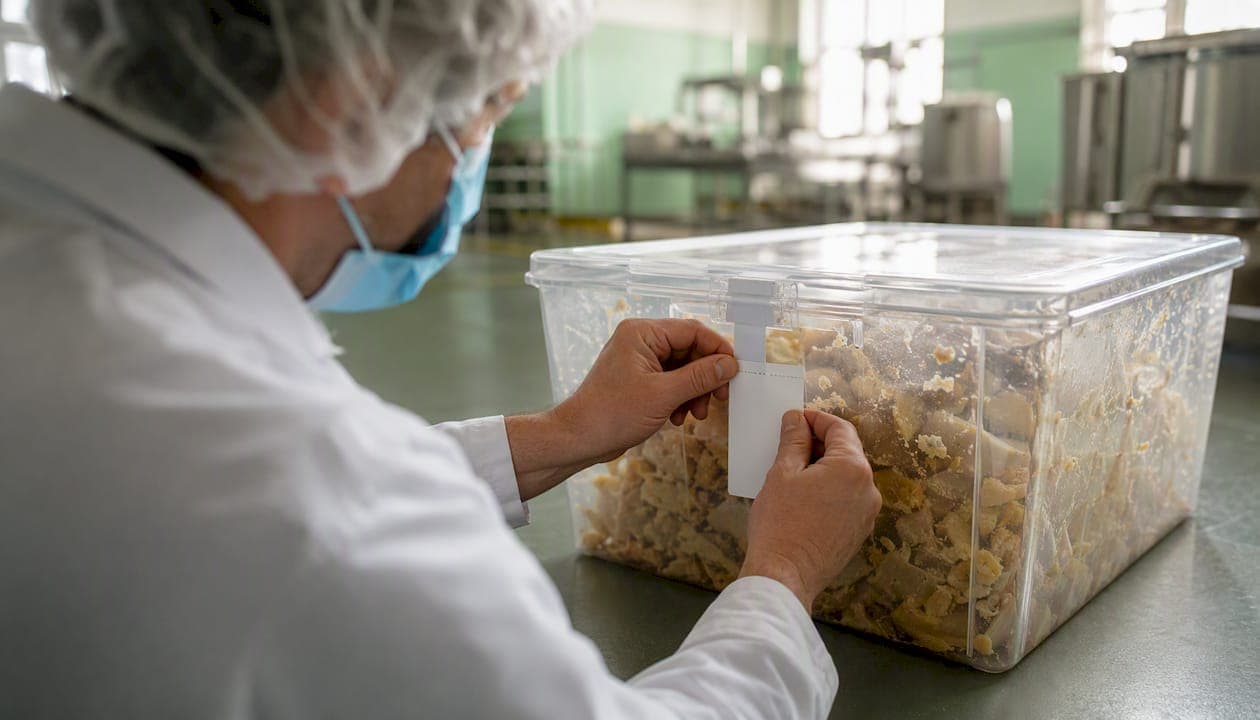
Stop untracked rework today. The single most effective first move in any rework reduction effort is to put a hold-and-identify flow in place before you touch anything else. Without that, you have no baseline, no root cause, and no way to prove improvement. Here is what to do in the next 48 hours:
- Hold and tag every rework item at the point it is generated. Use a physical tag or digital entry that captures product name, line, and time.
- Record origin and quantity for each event: which step produced it, estimated weight or volume, and the reason code (even a rough one like "overfill" or "startup loss").
- Assign a temporary owner for each batch. One person decides: rework, donate, or discard. No material moves without a decision and a record.
In those first 48 hours, capture: who generated it, what product, which line, what time, why it happened, and the estimated kilograms or liters. That data set becomes your Pareto chart by week two.
Key Takeaways
Reducing food rework requires a structured hold-and-identify flow, consistent KPI tracking, and Pareto-driven root-cause analysis applied to the vital few causes that drive the majority of rework volume.
| Point | Details |
|---|---|
| Start with a hold-and-identify flow | Tag, record, and assign every rework item within 48 hours before attempting any fix. |
| Measure % rework and first-pass yield | These two KPIs together tell you how much is recoverable and whether your fixes are working. |
| Pareto before you act | Two to four weeks of structured data will show that three to five reason codes drive most rework volume. |
| MOC and PRP cover every change | Any new recovery path or hardware change needs MOC sign-off and food safety plan review before going live. |
| Gembalabs accelerates the loop | Real-time equipment signals plus structured operator inputs give you the data set for Pareto analysis without manual consolidation. |
Table of Contents
- What does "rework" actually mean in food manufacturing?
- Why rework control matters beyond just saving product
- Common rework streams and the rules that make them acceptable
- How to measure rework: KPIs and sample calculations
- Which root-cause methods actually find rework drivers?
- Step-by-step actions to reduce rework at the plant
- Approval gates, documentation, and food-safety controls
- How sensors and operator inputs close the loop on rework
- Worked example: Pareto plus fishbone on a high-volume rework source
- Typical project timeline and ROI for rework reduction
- Your 30/60/90-day rework reduction checklist
- What actually makes rework programs stick
- Real-time rework tracking without a full MES build
- Sources
What does "rework" actually mean in food manufacturing?
The U.S. Code of Federal Regulations gives the working definition: rework is clean, unadulterated food removed from processing for reasons other than insanitary conditions, or food that has been successfully reconditioned by reprocessing. That language comes from 21 CFR 117.3 and is the regulatory baseline every U.S. plant operates under.
The practical distinction matters on the floor. Rework stays within the product's safety and identity envelope and can re-enter the production flow under controlled conditions. Scrap and waste cannot, because they have either been exposed to insanitary conditions, lost their identity, or crossed an allergen or microbiological threshold that disqualifies them. Industry PRP guidance frames rework not as a salvage workaround but as a controlled operational practice that belongs inside your Prerequisite Program structure.
Operational rule of thumb for plant teams: At the point of generation, ask three questions. Is the material clean and unadulterated? Does it share the same allergen profile as the product it will re-enter? Can you trace it back to its origin batch? If all three answers are yes, it is a rework candidate. If any answer is no, route it to controlled waste or a donation pipeline.
Why rework control matters beyond just saving product
The cost case is straightforward. Every kilogram of rework represents raw material already paid for, labor already spent, and line time already consumed. Rework handling adds a second round of labor, storage, and often a quality inspection before the material can re-enter production. When rework volumes run high, the throughput loss compounds: the line that generated the rework is also the line that must absorb it later, compressing available run time.
The safety case is less obvious but more consequential. Mishandled rework creates allergen cross-contact risk, microbiological exposure from improper storage, and traceability gaps that turn a minor nonconformance into a recall scenario. Lose the chain of custody on a rework batch and you may not be able to bound the affected lot during an investigation.
The sustainability case is increasingly a regulatory one. The U.S. national strategy sets a target to halve food loss and waste by 2030, with prevention and organics recycling as the preferred pathways. food supply](https://foodindustryexecutive.com/2026/07/product-recovery-food-manufacturing/), and reducing loss before it reaches the drain delivers the greatest environmental benefit. Plant-level rework reduction is one of the most direct ways a manufacturer contributes to that goal.
Common rework streams and the rules that make them acceptable
Most plants deal with a handful of recurring rework streams. Knowing which rules apply to each one saves time and prevents costly mistakes.
Common streams you will encounter:
- Startup and shutdown headers: Product displaced during line startup or CIP transitions. Acceptable for rework only when interface detection confirms no mixing with cleaning chemistry.
- Trim and off-cuts: Bakery, deli, or formed-product trim that is clean and within temperature control. Scrap-dough reuse in bakery is the classic example; the material is blended back at a controlled inclusion rate.
- Partial batches: Batches that did not complete due to equipment stops or recipe deviations. Acceptable if the deviation did not compromise safety or identity.
- Recovered headers from fillers and trucks: High-value product recovered from filler bowls or tanker returns. Requires validated hold-up quantification before recovery is credible.
The acceptance rules that apply across all streams: material must be stored under appropriate temperature control, labeled with origin and date, held in a designated rework area separate from raw materials, and released by QA before re-entry. Critically, allergen matching is non-negotiable. Do not add rework to a product with a different declared allergen profile. When the allergen status is uncertain, route the material to controlled waste or a food bank donation pipeline rather than risk a mislabeling event.
How to measure rework: KPIs and sample calculations
You cannot reduce what you have not measured. The core KPIs for any rework program are:
Sample calculation: A line produces 10,000 kg per shift. Operators log 420 kg of rework. If the fully loaded cost to handle and reprocess that material is $1.80 per kg, the shift cost is $756. Over 250 production shifts per year, that is $189,000 in rework-handling cost before you account for the throughput you did not produce during the time spent on it.
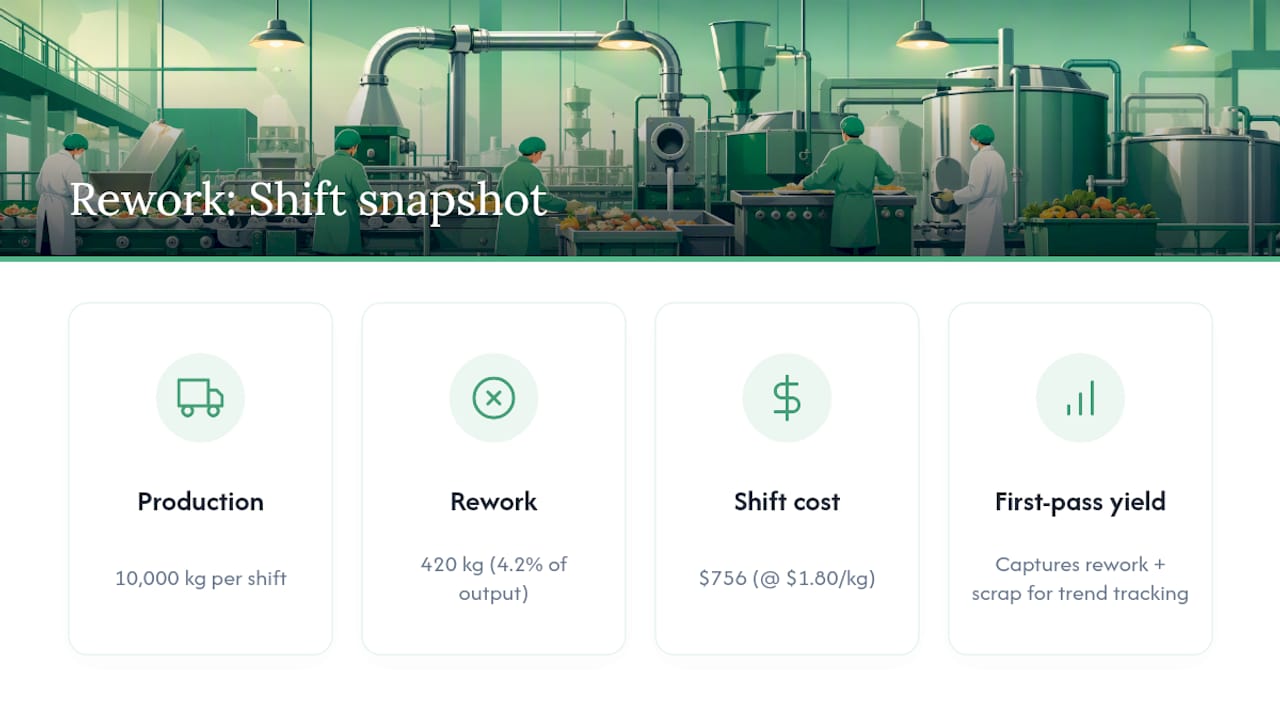
First-pass yield is the cleaner metric for trend tracking because it captures both rework and scrap in a single number.
Minimum data capture per event: origin line, production step, time and date, quantity (kg or liters), reason code, operator ID or shift, and storage conditions. Without reason codes, your Pareto chart is a list of weights with no actionable structure.
Pro Tip: Set up a short structured log, either paper or digital, with five fixed fields. Free-text notes produce inconsistent reason codes that are nearly impossible to group for Pareto analysis. Two weeks of clean structured data beats six months of narrative notes.
Which root-cause methods actually find rework drivers?
Three tools do most of the work. Choosing the right one for the situation is half the battle.
-
Pareto analysis is your first move after two to four weeks of structured data. Group reason codes, sum the quantities, and rank them. In most plants, three to five reason codes account for roughly 80% of rework volume. Those are the only ones worth engineering solutions for right now. Case studies in food plants consistently show that focusing corrective action on the vital few causes produces measurable reductions; spreading effort across all causes produces almost none.
-
Fishbone (cause-and-effect) diagram is the right tool once Pareto has identified a specific top cause and you need to understand why it happens. Run a 45-minute cross-functional session with operators, maintenance, and QA. Work through six categories: Machine, Material, Method, Measurement, Manpower, and Environment. Practical prompts: Is the equipment calibrated and maintained? Is the incoming material within spec? Is the SOP clear and followed consistently? Are measurements taken at the right frequency? Are operators trained and rotated correctly? Are temperature or humidity conditions contributing?
-
5 Whys is the fastest tool for a single, well-defined event. Start with the symptom and ask why five times. It works best when one person or one shift owns the problem and the cause chain is linear. It breaks down when the cause is systemic or involves multiple interacting variables.
Single-discipline investigations miss the interactions between equipment state, operator behavior, and recipe parameters that drive chronic rework.
Step-by-step actions to reduce rework at the plant
Structure the work in three phases. Each phase has a different owner mix and a different type of action.
0–30 days: contain and record
The goal in the first month is not to fix anything permanently. It is to stop the bleeding and build the data set. Designate a physical hold area with clear signage. Create or print a rework log sheet with the five required fields. Brief every shift on the new tagging requirement. Assign a QA lead to review and release or reject all rework material daily. Identify the top two or three reason codes from the first two weeks of data.
Quick wins in this phase: clarify the SOP for startup procedures (many plants have no written startup sequence, which is where a large share of header losses originate), add a buffer handling step to prevent product from being swept to drain during line transitions, and establish a clear labeling system so rework material is never confused with raw ingredients.
30–90 days: root-cause fixes and standard work
Once you have a Pareto, run a fishbone session on the top cause. Develop a corrective action with a specific owner and a 30-day completion date. Implement standard work for the steps most likely to generate rework: startup sequences, filler changeovers, and end-of-run recovery. Calibrate sensors that feed fill-level or weight data. Add recipe lockouts in your MES or batch record system to prevent operator overrides that cause off-spec product.
90–180 days: engineering and monitoring
This phase addresses the structural causes that short-term fixes cannot reach. Line rebalancing to reduce stop-start frequency, CIP sequence review to recover product from headers before cleaning chemistry enters, hygienic recovery hardware where product is currently lost to drain, and a formal operator training program tied to the updated SOPs. Any hardware change to a recovery path must pass through Management of Change before it goes live.
Approval gates, documentation, and food-safety controls
Rework without documentation is a compliance liability. The records auditors and regulators expect fall into three categories.
-
PRP integration: Rework should sit inside your Prerequisite Program structure, not as a standalone procedure. Define the rework PRP with scope, controls, monitoring frequency, corrective actions, and verification steps. This elevates rework from an ad-hoc practice to a controlled operational element.
-
Batch Manufacturing Record (BMR) or electronic Batch Record (eBR) entries: Every rework addition to a batch must be recorded in the batch record with: origin batch number, quantity added, QA release signature or electronic approval, and the disposition decision. This is the minimum auditor-friendly record set. Traceability guidance recommends retaining these records for at least two years to support recall investigations, though your specific FSMA obligations may require longer.
-
Management of Change (MOC) for recovery projects: Any change to a recovery or rework path, including new piping, new hold containers, or a new inclusion point in a recipe, must pass through MOC. The process engineering framework for product recovery is explicit: define boundaries, quantify hold-up, validate interface detection, and review the food safety plan before any recovery modification goes live. MOC checklist items specific to rework: confirm sanitary fittings, eliminate dead legs, verify allergen flow does not create cross-contact, and document sanitation validation for the new path.
-
Sign-off structure: Production lead approves the rework event and quantity. QA approves the release decision and allergen check. Sanitation signs off on any new hardware before first use. No rework material re-enters production without QA release.
How sensors and operator inputs close the loop on rework
Real-time signals catch rework triggers before they become large losses. The highest-value signals to monitor: line speed deviations (a slowdown often precedes a startup loss), fill-level trends (drift toward the low end predicts underfill rework), temperature spikes in holding areas, stop-start frequency per shift, and turbidity changes in CIP circuits that indicate product-water interface.
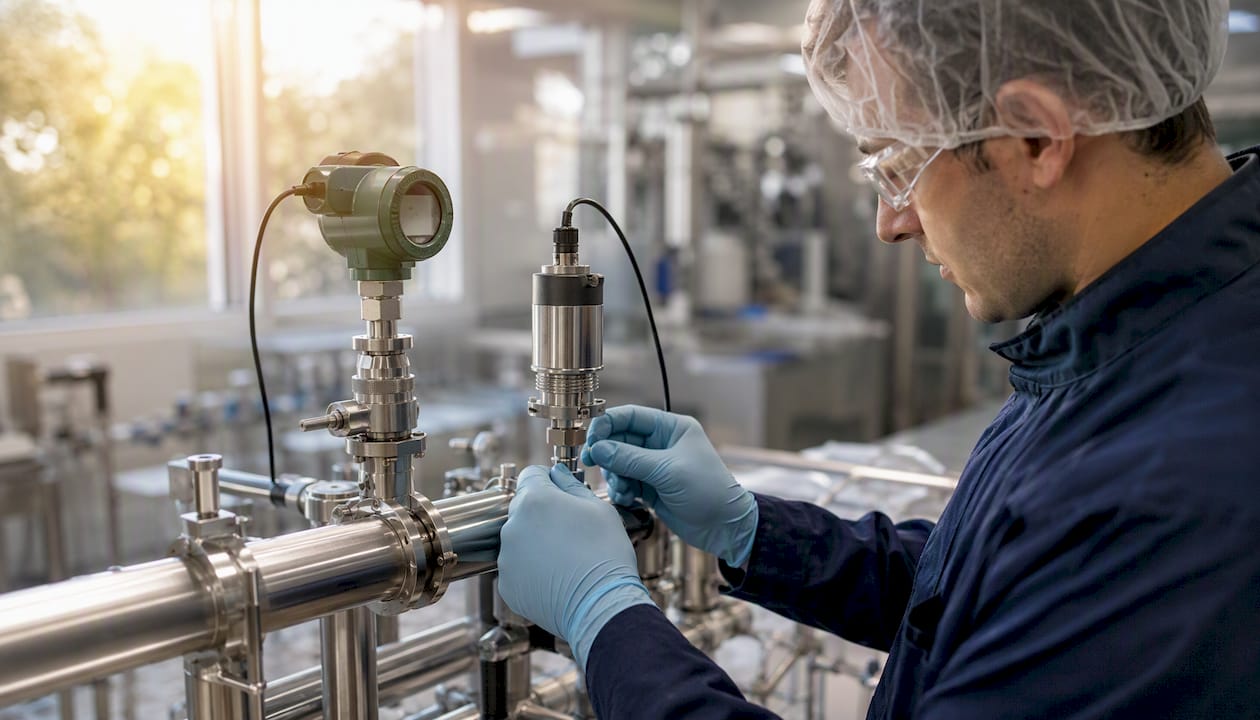
The practical workflow looks like this: an event trigger (speed deviation, operator tag-in, or sensor threshold breach) initiates an auto-hold flag. The operator adds a structured note with two or three required fields: reason code, estimated quantity, and affected product. QA receives the flag, performs a quick inspection, and routes the material to rework holding or discard. The event is logged to the KPI dashboard with the reason code attached.
Pro Tip: Use bilingual operator prompts (English and Spanish) in your digital log. In many U.S. food plants, a significant share of the production workforce is more comfortable in Spanish. A prompt they can read and respond to accurately produces better data than one they interpret and approximate.
IoT sensor approaches make this workflow faster and more consistent. Sensors capture the objective signal; the operator adds the contextual note. Together, they give you the what and the why in a single record. Validate sensor thresholds with bench tests before relying on them for auto-hold decisions, and review thresholds quarterly as product mix or line speeds change.
Product recovery from headers and CIP circuits specifically requires validated interface detection. Without it, you risk mixing product with cleaning chemistry or creating dead legs that become sanitary hazards. This is an engineering problem, not a procedure problem, and it requires the same rigor as any other food safety control.
Worked example: Pareto plus fishbone on a high-volume rework source
Baseline data collection (weeks 1–4):
- Operators logged every rework event using a five-field paper form: line, step, time, quantity (kg), reason code.
- QA consolidated logs daily and entered them into a spreadsheet grouped by reason code.
- At the end of week four, the team had 112 logged events totaling 1,840 kg of rework.
Pareto results:
The team ran a fishbone session on each.
Fishbone findings for startup header loss: No written startup sequence existed. Operators used different amounts of product to prime the line, and the excess went to rework. Fix: a written startup SOP with a defined prime volume, implemented in week six.
Fishbone findings for underfill at filler #2: The filler's level sensor had drifted out of calibration. Fix: sensor recalibration and a weekly calibration check added to the PM schedule.
Before/after KPIs (8 weeks post-intervention):
- % Rework: 5.8% → 2.9%
- First-pass yield: 94.2% → 97.1%
- Rework events per shift: 4.3 → 2.1
Common pitfalls: Teams often fix the symptom (retrain the operator) rather than the cause (no SOP existed). Validate the fix by running the same Pareto on the next four weeks of data. If the top reason code drops in volume, the fix is working. If it does not, the root cause is deeper than the corrective action reached.
Typical project timeline and ROI for rework reduction
Most rework reduction projects move through four stages. The diagnostic phase (weeks 1–4) costs primarily in QA and production lead time to set up logging and review data. The pilot phase (weeks 5–12) adds any hardware or SOP costs for the top one or two corrective actions. The scale phase (months 4–6) extends validated fixes to other lines or shifts. The embed phase (months 6–12) locks in standard work, training, and monitoring routines.
Cost categories to budget:
- Labor for RCA sessions and data review (typically 8–16 hours of cross-functional time in the diagnostic phase)
- Temporary containment materials (hold bins, tags, signage): low cost, high impact
- Sensor recalibration or replacement: varies by equipment, often $200–$800 per sensor
- Software or MES integration for structured logging: depends on existing infrastructure
- Operator training time: budget 1–2 hours per operator for SOP rollout
At a fully loaded product cost of $2.50 per kg, that is $725 per day, or roughly $181,000 per year. The SOP development and sensor recalibration cost less than $2,000 combined. Payback was measured in days, not months.
Prioritize low-cost, high-impact fixes first. Reserve capital expenditure for engineering changes that have been validated on a pilot scale.
Your 30/60/90-day rework reduction checklist
Days 1–30 (production lead and QA own this)
- Designate a physical rework hold area with clear labeling and temperature control.
- Create a five-field rework log (paper or digital) and brief all shifts.
- Assign a daily QA review and release/reject decision for all rework material.
- Collect baseline data: log every event with reason code and quantity.
- Identify the top two or three reason codes from the first two weeks.
Days 31–60 (cross-functional: production, QA, maintenance)
- Run a Pareto on the first 30 days of data and present findings to the team.
- Hold a fishbone session on the top cause; assign corrective actions with owners and due dates.
- Implement SOP changes or calibration fixes from the fishbone session.
- Begin tracking first-pass yield alongside % rework.
- Review rework records for allergen compliance and traceability completeness.
Days 61–90 (maintenance and engineering join)
- Validate that corrective actions from days 31–60 reduced the target reason code.
- Run a second Pareto; address the next top cause.
- Submit any hardware changes through MOC and food safety plan review.
- Conduct operator training on updated SOPs; document completion.
- Set KPI targets for the next quarter and assign a monitoring owner.
Red flags that signal a deeper problem: Rework trending upward after corrective actions are in place. The same reason code appearing on multiple lines simultaneously. Recurring equipment faults tied to rework events (this points to a maintenance or design issue, not an operator issue). Any of these warrants a cross-functional escalation rather than a line-level fix.
What actually makes rework programs stick
The programs that hold are the ones where operators feel ownership, not compliance. The most common failure mode is a QA-driven initiative that operators experience as extra paperwork with no visible benefit to them. The fix is simple: share the data back. Post the weekly % rework number on the line. When it drops, say so out loud in the daily huddle. When a corrective action an operator suggested actually worked, name it.
One pattern that shows up repeatedly in plant implementations: the first Pareto almost always surprises the team. The cause everyone assumed was the biggest driver turns out to be third or fourth on the list. That moment, when the data contradicts the assumption, is the most valuable thing a structured rework program produces. It redirects effort from where people think the problem is to where it actually is.
Change management in food manufacturing is not complicated, but it is slow. Expect three to four weeks before new logging habits are consistent. Expect six to eight weeks before corrective actions show up clearly in the KPIs. Celebrate the leading indicators (consistent logging, complete reason codes, zero untagged rework events) before the lagging ones (% rework, first-pass yield) catch up. Daily huddles are the right venue for this: two minutes on the rework number, one acknowledgment of what the team did right, one focus for the shift.
Real-time rework tracking without a full MES build
Tracking rework across multiple lines manually is where most small and mid-sized plants hit a wall. The data exists, but it lives in paper logs, shift notes, and memory. Gembalabs is built specifically for that gap.
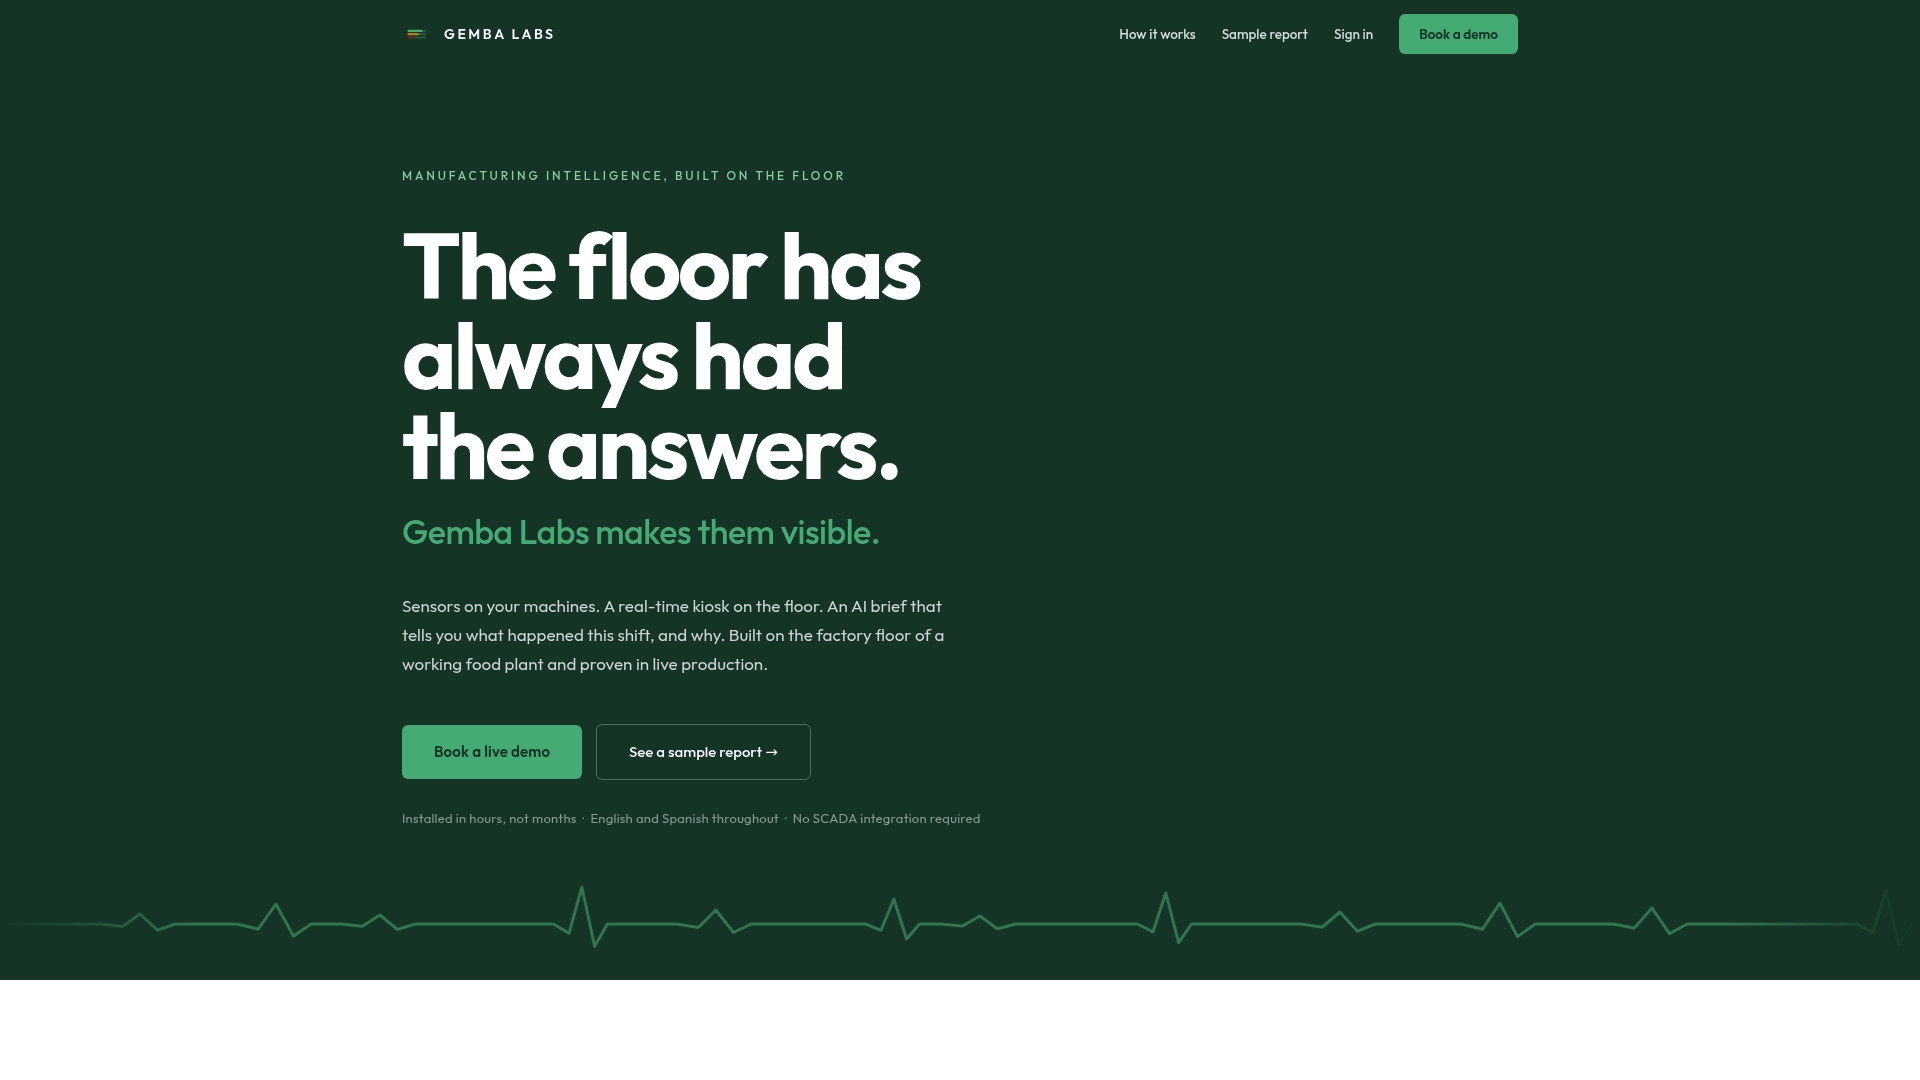
The platform pulls real-time signals from your equipment, combines them with structured operator inputs, and generates AI-powered reports on downtime, rework events, shift results, and recurring issues. Bilingual prompts (English and Spanish) mean your whole team can log accurately. KPI dashboards update as events are captured, so you see your % rework and first-pass yield in real time rather than the following morning.
A typical pilot runs on one line for 30 days: establish the baseline, apply your top corrective actions, and measure the change. That structure maps directly onto the Pareto-driven methodology in this article. See how the intelligence product works and request a demo to scope a pilot for your facility.
Sources
- Reducing Food Waste Before It Reaches the Drain: A Process Engineering Framework for Product Recovery in Food Manufacturing
- National Strategy for Reducing Food Loss and Waste and Recycling Organics | US EPA
- How to manage food rework in your business - HACCP Mentor
- Minimization of Rework in Food Industry by Applying Pareto Chart and Cause Effect Diagram