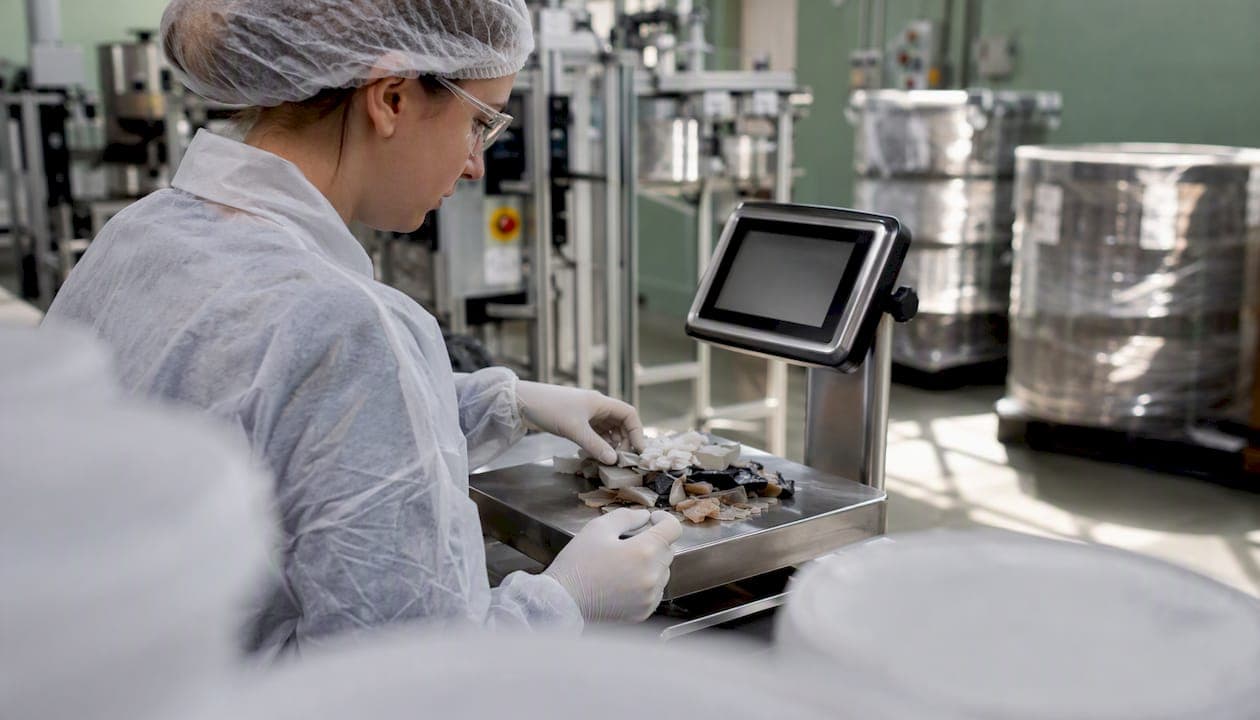
The fastest path to lower manufacturing scrap is three steps: run a mass-balance audit to find where product is actually disappearing, fix the top two loss mechanisms with a validated trial, then instrument same-shift alerts so drift gets caught before it compounds. Most plants skip step one and wonder why step three never sticks.
Start here, this week:
- Day 1–2: Weigh every scrap and trim stream at the end of one shift. Log the weight, the SKU, and the line event that generated it. You don't need sensors yet — a floor scale and a clipboard work.
- Day 3–5: Run a single controlled product-recovery trial on your highest-volume changeover. Capture displaced product, weigh it, compare to your calculated hold-up. That number tells you whether recovery is worth engineering.
- Day 6–7: Brief the cross-functional team (QA, maintenance, ops) on findings. Set one success metric and a four-week pilot scope.
Key Takeaways
Scrap reduction in food manufacturing requires a clean measurement baseline, a validated intervention on the top two loss causes, and same-shift visibility to prevent drift from compounding.
| Point | Details |
|---|---|
| Measure before you intervene | Weigh and log every scrap stream by SKU and event type for at least two weeks before changing anything. |
| Mass balance reveals hidden losses | Reconcile input weight against all outputs — finished goods, trim, rework, and recovered material — to find unaccounted loss. |
| Pilot on one line, four to eight weeks | Define success metrics upfront; compare Pareto and control charts against a clean baseline before scaling. |
| Same-shift alerts prevent compounding | Real-time signals tied to standardized corrective actions stop drift events before they run through an entire batch. |
| Gembalabs supports the full cycle | Sensor data, operator inputs, and AI-generated shift reports give SME plants the visibility to sustain scrap reduction after the pilot. |
Table of Contents
- Which scrap and yield metrics should you measure first?
- How to measure and validate losses with mass balance and recovery trials
- Engineering loss out: SOPs, changeover, batch sizing, and sequencing
- How maintenance and uptime practices reduce scrap from breakdowns and standing time
- Sensor-first yield management: same-shift detection and corrective actions
- How to run a short pilot, validate results, and scale
- Safe byproduct recovery and upcycling after prevention is exhausted
- What scrap-reduction projects typically cost and when to expect ROI
- A practical perspective on what actually works in small-to-medium food plants
- Gembalabs makes the pilot-first approach easier to sustain
- Research and resources used in this guide
- Sources
Which scrap and yield metrics should you measure first?
Before any intervention, you need a shared vocabulary and a baseline. Without one, "we reduced scrap" means something different to every person in the room.
| Metric | Definition | How to calculate |
|---|---|---|
| Scrap rate | Percentage of input lost as unrecoverable waste | (Scrap mass ÷ Input mass) × 100 |
| First-pass yield (FPY) | Product meeting spec on the first run, no rework | (Conforming units ÷ Total units started) × 100 |
| Rework % | Product requiring reprocessing before release | (Rework mass ÷ Input mass) × 100 |
| Giveaway | Product weight above declared fill weight | (Actual fill − Target fill) ÷ Target fill × 100 |
| Hold-up mass | Product trapped in lines, headers, or dead legs | Pipe volume × fill factor × product density |
| Downtime attributed to scrap | Minutes lost to scrap-related stoppages | Sum of event durations logged per shift |
Collect data at the batch or SKU level, not just the daily aggregate. A daily total hides which product or line event is driving losses. Tie each scrap entry to a timestamp and a line event so you can run a Pareto later.
- Weigh trim bins before and after each shift, not just at end of day.
- Record event type alongside weight: changeover, startup, breakdown, or quality hold.
- Track first-pass yield separately from rework — conflating them masks where product actually fails.
- Use the same scale for all measurements in a trial period to eliminate instrument error.
Pro Tip: Start with manual measurements for two full weeks before adding any sensor. Manual data forces operators to engage with the numbers and surfaces data-quality problems (wrong bins, missed events) that sensors would silently inherit.
How to measure and validate losses with mass balance and recovery trials
A mass-balance protocol is the foundation of credible scrap reduction work. It tells you what is actually leaving the system versus what your records say should be there.
Running a mass-balance protocol
- Define the boundary. Choose one line or one process step. Include all inlets (raw material, rework added) and all outlets (finished product, trim, rework out, waste, and recovered material).
- Weigh all inputs at the start of the batch or shift. Record by ingredient lot.
- Weigh all outputs at the end: finished goods, trim bins, rework bins, and any material sent to waste.
- Reconcile. Input mass minus output mass equals unaccounted loss. If that number is large, you have hidden hold-up or misclassified streams.
- Repeat for three consecutive batches before drawing conclusions. Single-batch data is too noisy.
Controlled product-recovery trial checklist
A product-recovery trial verifies whether the material trapped in your lines is worth recovering and whether recovering it is safe.
- Define the trial boundary: which valves, headers, and transfer lines are in scope.
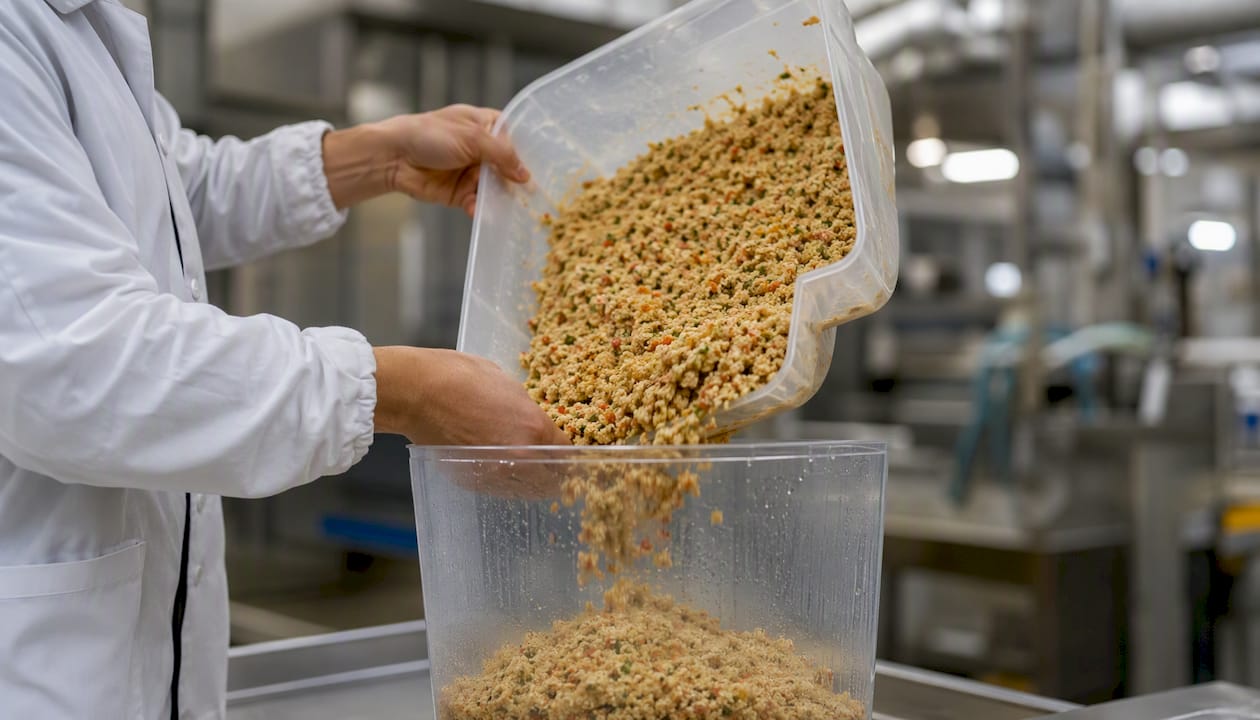
- At the end of a normal production run, capture all displaced product in a clean, labeled container before cleaning begins.
- Weigh the recovered material. Compare to your calculated hold-up (pipe volume × fill factor × density).
- Evaluate against QA specs: temperature, time out of temperature, allergen status, and visual condition.
- Classify as rework (meets spec, can re-enter process under MOC) or waste (fails any criterion).
| Trial field | What to record |
|---|---|
| Date and shift | Identifies operator and conditions |
| Line and boundary | Defines scope for repeatability |
| Calculated hold-up (kg) | Pipe volume × fill factor × density |
| Recovered mass (kg) | Actual weight captured |
| Recovery rate (%) | Recovered ÷ Calculated × 100 |
| QA disposition | Rework / Waste / Hold for review |
Pro Tip: Run your first recovery trial on a Saturday after a normal Friday production run. You get a clean window, no production pressure, and a full team available to observe. The data from one well-documented weekend trial is worth more than three months of estimates.
Engineering loss out: SOPs, changeover, batch sizing, and sequencing
Good-process planning — stable material flow, right-sized batches, and equipment maintained to spec — is the primary lever for reducing manufacturing scrap before it is created. Fixing losses after the fact costs more and sticks less.
Lean Six Sigma tools give you a structured way to find the vital few causes. Use DMAIC to frame the project, Value Stream Mapping to see where product sits idle or transitions poorly, and a Pareto chart to rank loss modes by volume. In most plants, two or three causes account for the majority of scrap.
Changeover optimization checklist:
- Sequence SKUs from light to dark, low allergen to high allergen, to minimize purge volume.
- Install recapture valves or divert-to-rework logic at key transfer points before cleaning begins.
- Document the purge sequence in a written SOP with step-by-step valve positions and timing.
- Time each changeover step and log it. Unlogged time is where scrap hides.
Batch sizing and recipe standardization:
- Calculate the minimum batch size that keeps your line full without creating excess standing volume.
- Standardize portion weights and fill targets by SKU. Every gram of variance above target is giveaway; every gram below is a quality hold.
- Review standard work documentation for each line at least quarterly. SOPs that drift from actual practice are a leading cause of rework.
- Use prevention-focused line optimization before adding recovery steps — prevention preserves upstream resource inputs and costs less to sustain.
Pro Tip: Run a Pareto on your scrap log after two weeks of manual data. Ignore everything else until those two are fixed.
How maintenance and uptime practices reduce scrap from breakdowns and standing time
Breakdown scrap is often invisible in yield reports because it gets logged as downtime, not waste. The two are the same event from a yield perspective: every minute a line stands with product in it is product at risk.
- Pre-run checks: verify seal integrity, temperature setpoints, and fill-head calibration before the first unit runs.
- Post-run cleaning: log any residue or buildup that could affect the next run's first-pass yield.
- Weekly: inspect drive belts, seals, and sensors tied to fill accuracy. Log findings in a maintenance record linked to the line and SKU.
- Monthly: review downtime logs against scrap logs. If a machine failure precedes a scrap spike, that equipment is a priority for preventive maintenance.
Operator-driven sign-off forms that capture pre-run and post-run conditions create the FSMA-aligned records you need for validated recovery decisions. A simple paper form or a digital entry in a production report takes under two minutes per shift and gives you an audit trail.
- Create a one-page pre-run checklist per line. Include temperature, fill weight, seal check, and sensor status.
- Require a supervisor sign-off before the first unit runs.
- Log any deviation and its resolution. Unresolved deviations should trigger a hold, not a restart.
Sensor-first yield management: same-shift detection and corrective actions
Real-time material-loss analysis turns delayed yield visibility into same-shift intervention. Without it, you find out about a drift event at the end-of-day report — after thousands of units have run off-spec.
Signals worth monitoring:
- Flow totalizers on transfer lines to detect hold-up and line losses in real time.
- Checkweighers and in-line scales for giveaway and underfill detection.
- Temperature sensors at critical control points tied to product-safety and quality specs.
- Motor current or drive signals as virtual sensors for pump and conveyor health.
- Turbidity or density meters at recovery boundaries to detect product-in-drain events.
Map each signal to a standardized corrective action in your SOP. An alert means nothing if the operator doesn't know what to do with it. Gembalabs collects equipment-cycle data and operator inputs in one place, then generates AI-produced shift reports that surface recurring issues and flag drift before it compounds — the kind of same-shift visibility described in real-time equipment monitoring guidance.
Pro Tip: Build a human confirmation step into every automated alert. Sensors drift, and an unchecked automatic recovery action can create a food-safety event faster than the scrap it was meant to prevent. One operator confirmation before any divert valve opens is a non-negotiable safeguard.
How to run a short pilot, validate results, and scale
A four-to-eight-week pilot on a single line is enough to generate credible data and a go/no-go decision. Scope it tightly: one line, one or two loss modes, pre-defined success metrics.
- Week 1: Establish baseline. Collect scrap rate, FPY, and rework % for the line under normal conditions. No interventions yet.
- Weeks 2–4: Implement the intervention (changeover SOP, fill-weight control, recovery trial). Log every deviation.
- Week 5: Run Pareto and control charts on the new data. Compare to baseline.
- Week 6–8: Repeat the intervention under different shift conditions to confirm repeatability.
- Decision gate: If FPY improves and scrap kg/week drops against the pre-defined target, approve scale-up. If not, diagnose before expanding.
Cross-functional accountability matters here. QA owns the validation criteria. Maintenance owns the equipment-readiness sign-off. Operations owns the SOP execution. No single person owns all three, and that separation is what makes the result credible.
Single-quarter improvements in scrap rate are achievable when the top two loss causes are addressed with a structured pilot. The prerequisite is a clean baseline — which is why the mass-balance audit in week one is not optional.
Safe byproduct recovery and upcycling after prevention is exhausted
Prevention comes first. Once you have engineered out the losses you can prevent, validated diversion of remaining byproducts can recover additional value — but only under the same discipline used for production.
- Confirm QA disposition before any material leaves the production boundary: allergen status, hold time, temperature history, and visual inspection.
- Maintain identity separation between rework streams and primary product at all times.
- Document every diversion event with batch number, weight, disposition, and approver. This is your FSMA record.
- Set hold-time limits for recovered streams and enforce them. Material that exceeds the limit goes to waste, not rework.
Typical feasible byproduct streams include trim from portioning lines, off-spec product that meets ingredient-grade specs, and wash water with recoverable solids. Upcycling becomes economical at scale — smaller plants often find that animal feed or composting is the more practical route until volumes justify further processing.
Pro Tip: Apply the same mass-balance discipline to your recovery streams that you use for loss measurement. Weigh every recovered batch, log the disposition, and reconcile monthly. A recovery program that isn't measured is just a cost center with extra steps.
What scrap-reduction projects typically cost and when to expect ROI
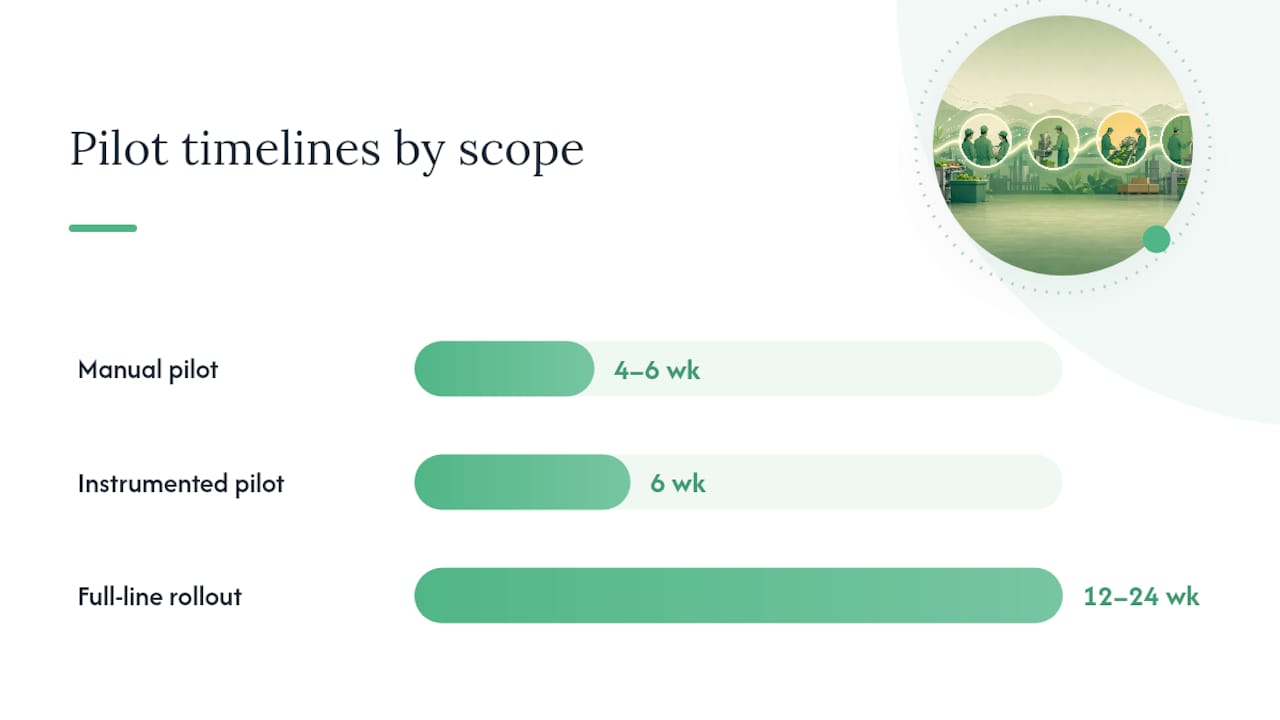
Cost components vary by starting point, but most pilots fall into three scenarios:
| Scenario | Typical scope | Approximate timeline |
|---|---|---|
| Manual pilot | Floor scales, clipboards, one engineer's time | 4–6 weeks to first data |
| Instrumented pilot | Existing sensors + MES license + staff hours | 6 weeks to validated result |
| Full line rollout | New sensors, piping changes, MES integration | 3–6 months to plant-wide baseline |
ROI calculation is straightforward: raw-material savings (recovered mass × ingredient cost) plus avoided rework labor plus reduced waste-disposal fees, divided by total project cost. A single changeover recovery trial that captures 50 kg of product per run at $2/kg ingredient cost returns $100 per changeover — before labor savings.
Common budget risks and how to reduce them:
- Overbuilding the sensor layer before validating the process change. Start with manual trials; add sensors only after the intervention proves out.
- Underestimating staff hours for data review and SOP updates. Budget at least four hours per week per line during the pilot.
- Reuse existing instrumentation where possible. Most plants have checkweighers and temperature sensors already; the gap is usually data collection and analysis, not hardware.
A practical perspective on what actually works in small-to-medium food plants
The conventional wisdom says you need a full MES rollout before you can manage yield seriously. That's wrong, and it delays results by months.
The plants that move fastest pick the top two loss modes from a two-week manual audit, run a single controlled trial, and document the result with enough rigor to convince QA. That's it. The sensor layer comes after the process is proven, not before.
SME constraints are real: limited engineering hours, mixed shift coverage, and equipment that was never designed with recovery in mind. The answer isn't to wait for a capital project. It's to design the pilot around what you already have — a floor scale, a clipboard, and one engineer who owns the result.
Gembalabs' evidence base on first-pass yield and equipment monitoring consistently points to the same pattern: measurement discipline and cross-functional accountability produce faster results than technology alone. The technology amplifies a process that already works. It doesn't substitute for one.
Gembalabs makes the pilot-first approach easier to sustain
Running a scrap-reduction pilot manually is the right starting point. Sustaining and scaling it is where most SME plants stall — because the data lives in spreadsheets, shift notes get lost, and no one sees the drift until it's already a problem.
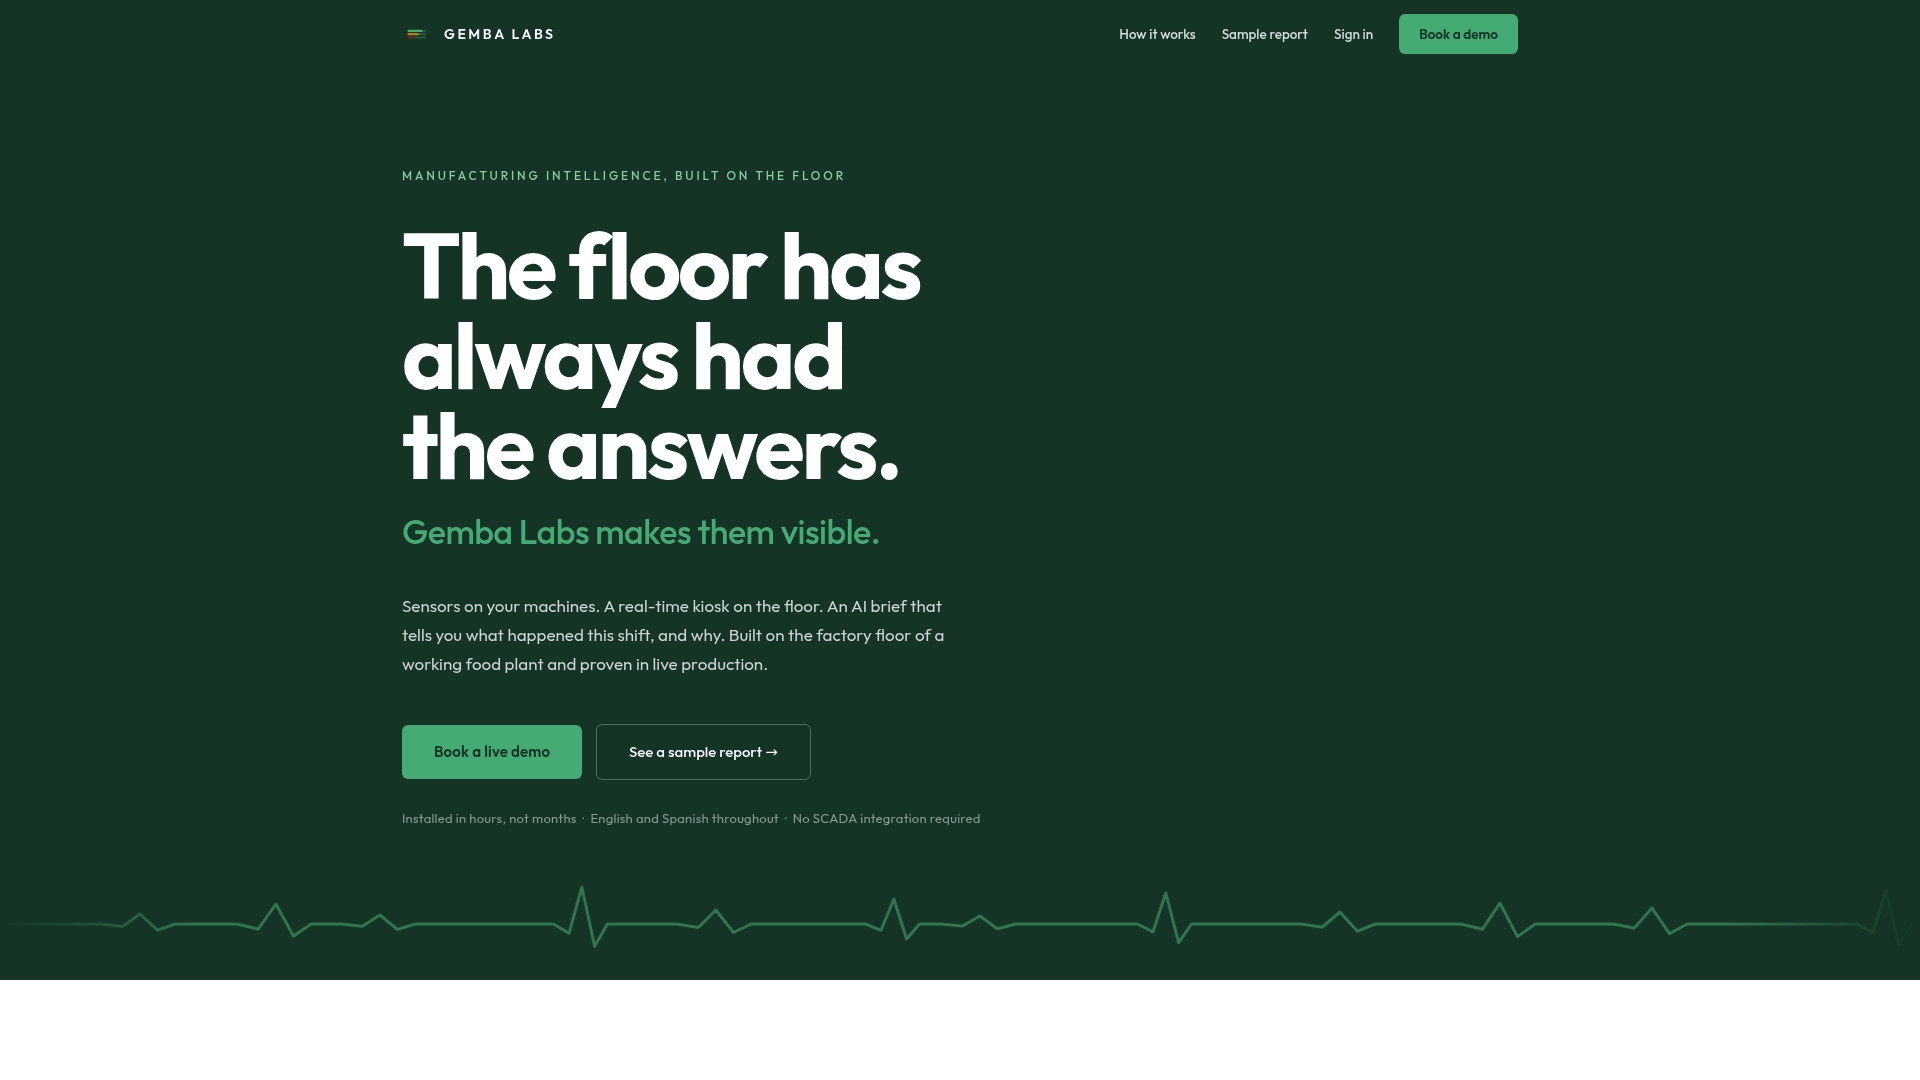
Gembalabs connects directly to your equipment cycles and collects operator inputs in one place. Its AI-generated reports summarize downtime, rework events, shift results, and recurring issues in plain language — in English or Spanish — so your team gets the same-shift visibility that prevents small deviations from becoming large scrap events. A typical pilot runs on a single line, takes a few weeks to instrument, and delivers a clear proof-of-value report your team can act on.
If you're ready to move from manual tracking to a system that flags problems before the shift ends, see how Gembalabs works and book a pilot conversation.
Research and resources used in this guide
- Recommendation of Good Practice in the Food-Processing Industry for Preventing and Handling Food Loss and Waste — MDPI Sustainability; process design, batch sizing, and equipment uptime as primary loss-prevention levers.
- Reducing Food Waste Before It Reaches the Drain: A Process Engineering Framework for Product Recovery in Food Manufacturing — Food Industry Executive; hold-up calculation, sensor-based boundary detection, and validated recovery trial protocols.
- Column: Yield Management — Food Engineering Magazine; real-time MES and material-loss analysis for same-shift intervention.
- Food Manufacturer Surplus Food & Waste Report — Food Industry Executive; prevention-first hierarchy and line optimization as highest-impact levers.
- Lean Six Sigma Methodology Applied to Food Manufacturing — ScienceDirect; DMAIC, VSM, Pareto, and FMEA as structured tools for identifying and removing process waste.
Next steps: Run the two-week manual mass-balance audit described in the metrics section, then use the product-recovery trial checklist to scope your first controlled trial. For a deeper dive into Lean Six Sigma DMAIC applications in food production, the ScienceDirect case study above is the most practical starting point.
Sources
- Recommendation of Good Practice in the Food-Processing Industry for Preventing and Handling Food Loss and Waste
- Reducing Food Waste Before It Reaches the Drain: A Process Engineering Framework for Product Recovery in Food Manufacturing
- Column: Yield Management
- Food manufacturer surplus food & waste report
- Lean Six Sigma methodology applied to food manufacturing (case study / analysis)